
What You Need to Know About PPI Inflation and the Stock Market

The latest PPI (Producer Price Index) number came out, and the news is not good. Long story short - inflation continues to rise. For now, anyway, the stock market has completely shrugged off any inflation concerns, focusing instead on the seemingly never-ending flood of money being pumped by the Fed.
So, should you be concerned about PPI inflation? Take a look at the results below and decide for yourself.
THE CALCULATIONS
PPI data for a given month is published during the following month. So, in September 2021, the PPI value for August was published. For what we are about to present, regardless of when the latest data is published, we will evaluate the latest results on the last day of the month and decide whether the model is favorable or unfavorable for stocks in the following month.
At the end of each month, divide the current value for the Producer Price Index by the value for the index 12 months ago, subtract 1.00 and multiply by 100.
For example:
- On 9/10, the August 2021 PPI value was reported as 232.90
- The August 2020 PPI value was 194.30
- So, at the end of September 2021, we will record the 12-month % change for PPI as +19.866% ((232.90/194.30)-1)*100
The chart below displays the 12-month percentage change for the Producer Price Index since 1914 with a solid blue horizontal line at the 9% threshold.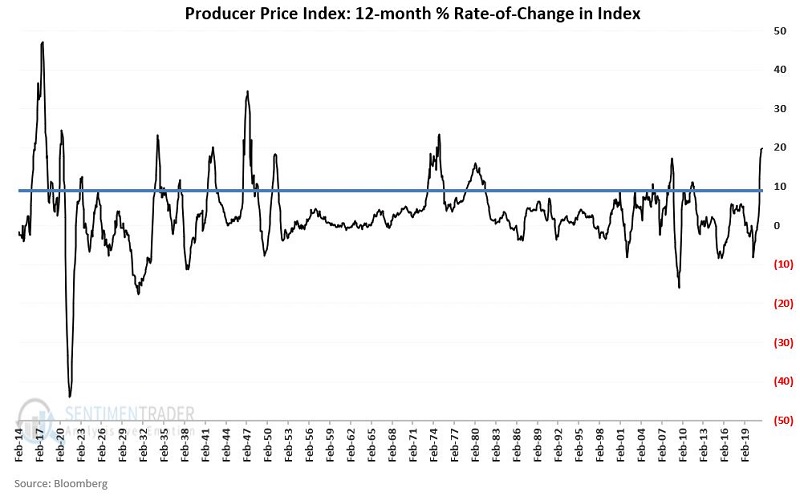
THE HISTORY
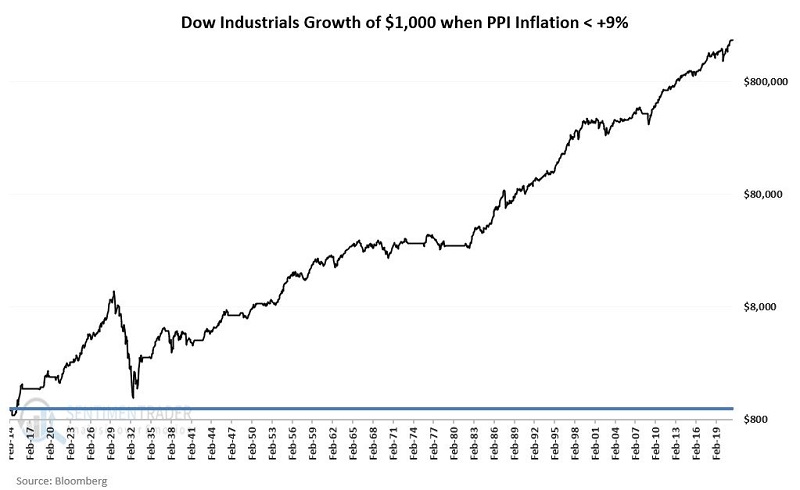
For this piece, we will focus strictly on the price performance of the Dow Jones Industrial Average during the months after a PPI 12-month % change of +9% or more.
The bottom line:
From February 1914 through August 2021:
- When PPI inflation was below +9%, the Dow gained +187,738%
- When PPI inflation was at or above +9%, the Dow lost -69%
The chart below displays the growth of $1,000 (on a logarithmic scale) invested in the Dow ONLY when PPI inflation (as calculated above) was below +9%.
The next chart displays the cumulative % +(-) achieved by holding the Dow ONLY when PPI inflation is +9% or higher.
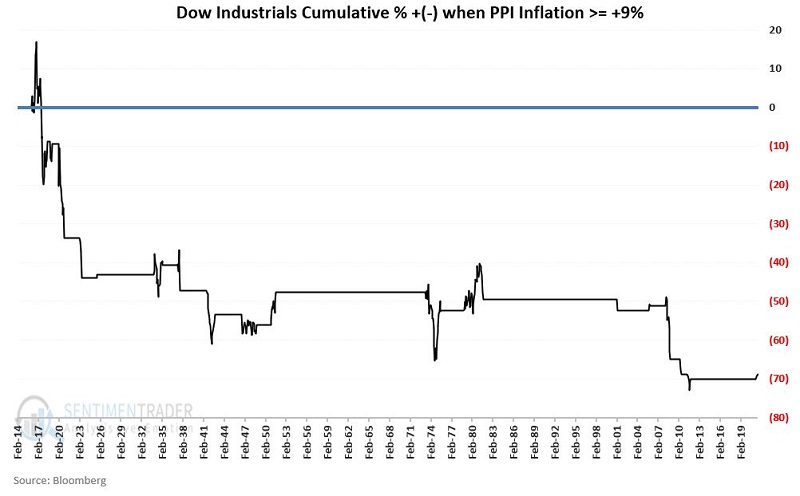
The key takeaways from the chart above:
- A PPI inflation rate of +9% or more DOES NOT guarantee a stock market decline
- However, it clearly has to be counted in the negative column when assessing factors that may influence the stock market
The table below displays the percentage price change for the Dow Jones Industrial Average during each >= +9% PPI inflation period.
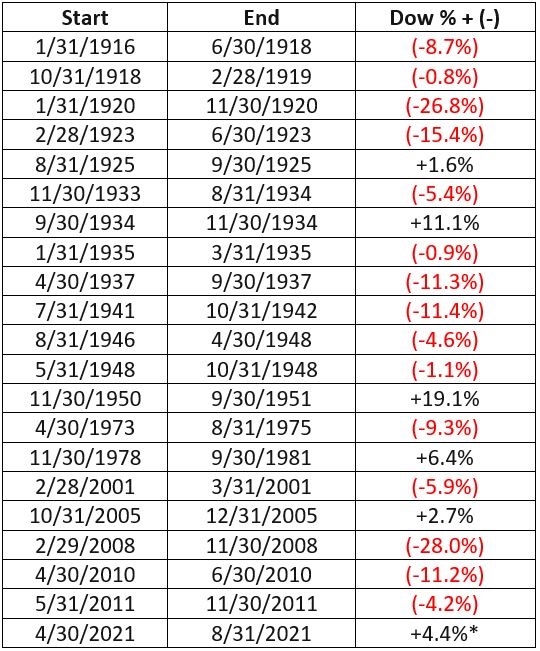
*Note that the period starting on 4/30/2021 is still in play with PPI inflation > 9%. For this period, Dow price performance is updated through the end of August 2021.
Over 20 previously completed periods of PPI >= +9%:
- 5 have shown a gain
- 15 have shown a loss
- Average gain = +8.2%
- Average loss = (-9.7%)
So far, the stock market has shrugged off the unfavorable PPI reading that began at the end of April 2021.
SUMMARY
The flood of Fed money may continue to overwhelm everything else in the stock market. But the longer inflation persists and the more it increases, the higher the likelihood that it may ultimately exert some negative influence on stock prices.
The historical bottom line:
- High inflation is not necessarily a reason to panic
- BUT, ignore high inflation at your own peril