Data &
Technology
Research
Reports
Report Solutions
Reports Library
Actionable
Strategies
Free
Resources
Simple Backtest Calculator
Simple Seasonality Calculator
The Kelly Criterion Calculator
Sentiment Geo Map
Public Research Reports
Free Webinar
Pricing
Company
About
Meet Our Team
In the News
Testimonials
Client Success Stories
Contact
Log inLoginSign up
< BACK TO ALL REPORTS

What this indicator is saying about investors' complacency

Jason Goepfert
2021-02-05
When investors are comfortable, they trade stocks based on their own merits, so correlations among stocks drop. Like it has lately.

It's a truism of markets, lasting decades if not centuries, that when investors panic, they sell everything together. When they're comfortable, they buy and sell securities on their individual merits.

That's why we see correlations among stocks and other assets rise during times of anxiety and fall during periods of complacency. This is notable now because the correlation among stocks in the S&P 500 has plunged to the lowest level in over a year.

S&P 500 member correlation'

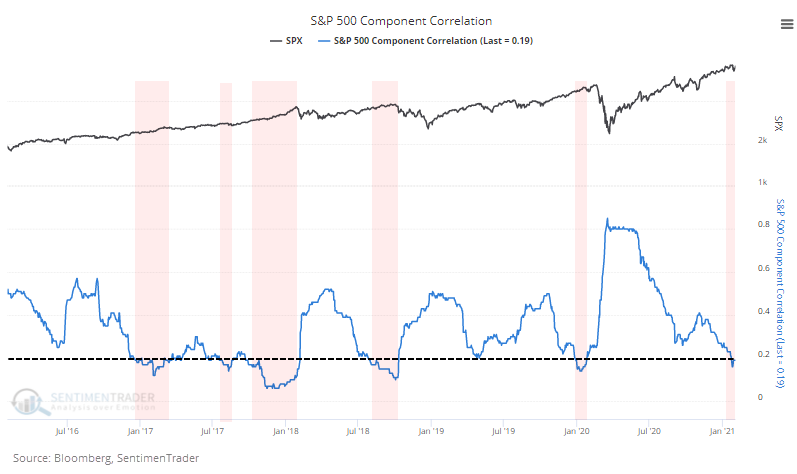
Correlations have gyrated in a wider range in recent years, so we can transform the data series above into a z-score. This compares the current reading to the average over the past year and adjusts for the standard deviation among those readings. This measure dropped below -1.5 in late January and has stayed right around that level.

When the S&P 500 has been at or near a high and the correlation z-score drops below -1.5, the index has had some trouble holding its momentum.  

What else we're looking at

  • Full returns following a large deviation move below average for S&P 500 member correlation
  • A look at what happens to cyclical/defensive stocks, small/large caps, and growth/value following these signals
  • Gold is close to ending one of the most impressive uptrends in 45 years
  • What is so special about the 11th day of the month?
  • A measure of gold's trend versus major currencies has hit an extreme

Stat Box

The S&P 500 has jumped more than 1% on 3 out of the past 4 days, to hit a new all-time high. It's only done this 18 other times since 1928, the last one being in June 1999.


Sentiment from other perspectives

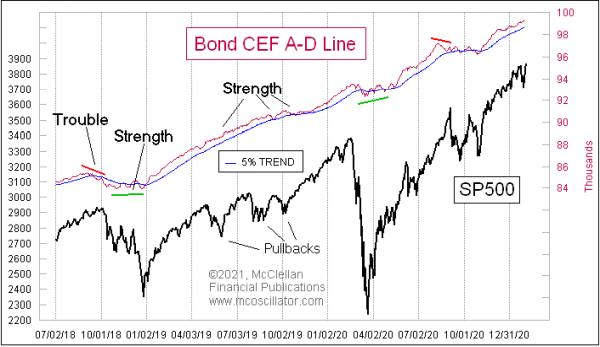
Closed-end bond funds are still holding strong. Signs that investors are euphoric are everywhere, but so far, there haven't been many signs that it's leading to a breakdown in leading areas of the market, such as credit-sensitive issues. Source: Tom McClellan

closed end bond fund line

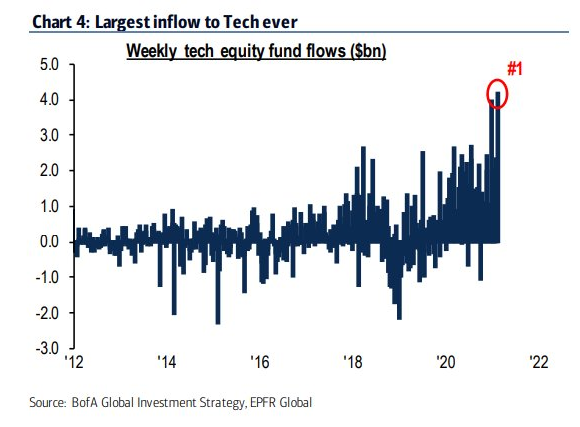
Might as well bet on tech. As long as things are humming, investors are comfortable putting a record amount of money into tech-focused ETFs. Party on! Source: Mike Zaccardi

weekly tech etf flow

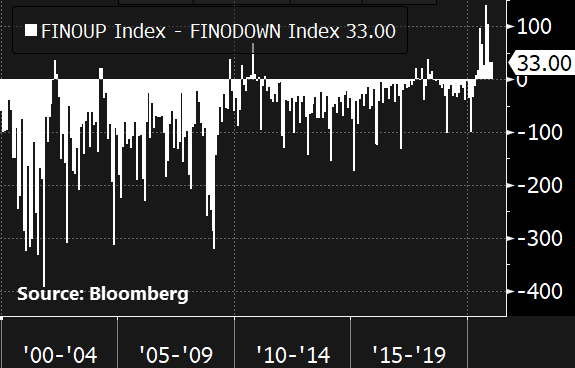
Companies are optimistic, too. The difference between the number of companies raising their financial outlooks minus lowering them has been above zero for 9 months in a row. Source: Bloomberg TV

company financial outlooks positive negative

DATA &
TECHnologies
IndicatorEdge
‍
BackTestEdge
‍
Other Tools
‍
DataEdge API
RESEARCH
reports
Research Solution
‍
Reports Library
‍
actionable
Strategies
Trading Strategies
‍
Smart Stock Scanner
‍
FREE
RESOUrCES
Simple Backtest
Calculator
Simple Seasonality
Calculator
The Kelly Criterion
Calculator
Sentiment Geo Map
‍
Public Research Reports
‍
Free Webinar
COMPANY
‍
About
‍
Meet our Team
‍
In the News
‍
Testimonials
‍
Client Success Stories
Pricing
Bundle pricing
‍
Announcements
‍
FAQ
© 2024 Sundial Capital Research Inc. All rights reserved.
Setsail Marketing
TermsPrivacyAffiliate Program
Risk Disclosure: Futures and forex trading contains substantial risk and is not for every investor. An investor could potentially lose all or more than the initial investment. Risk capital is money that can be lost without jeopardizing ones’ financial security or life style. Only risk capital should be used for trading and only those with sufficient risk capital should consider trading. Past performance is not necessarily indicative of future results.

Hypothetical Performance Disclosure: Hypothetical performance results have many inherent limitations, some of which are described below. No representation is being made that any account will or is likely to achieve profits or losses similar to those shown; in fact, there are frequently sharp differences between hypothetical performance results and the actual results subsequently achieved by any particular trading program. One of the limitations of hypothetical performance results is that they are generally prepared with the benefit of hindsight. In addition, hypothetical trading does not involve financial risk, and no hypothetical trading record can completely account for the impact of financial risk of actual trading. for example, the ability to withstand losses or to adhere to a particular trading program in spite of trading losses are material points which can also adversely affect actual trading results. There are numerous other factors related to the markets in general or to the implementation of any specific trading program which cannot be fully accounted for in the preparation of hypothetical performance results and all which can adversely affect trading results.

Testimonial Disclosure: Testimonials appearing on this website may not be representative of other clients or customers and is not a guarantee of future performance or success.