
What the Gold/SPX ratio is saying about gold now

Key points
- Stocks and gold have been strong performers in recent years, with each taking a turn in the lead
- At the moment, according to one historical measure, gold may be taking a more decisive leadership role
- This relationship can change rapidly, but the indicator detailed below can help traders stay on the right side of the big moves
Gold should be considered on a relative basis
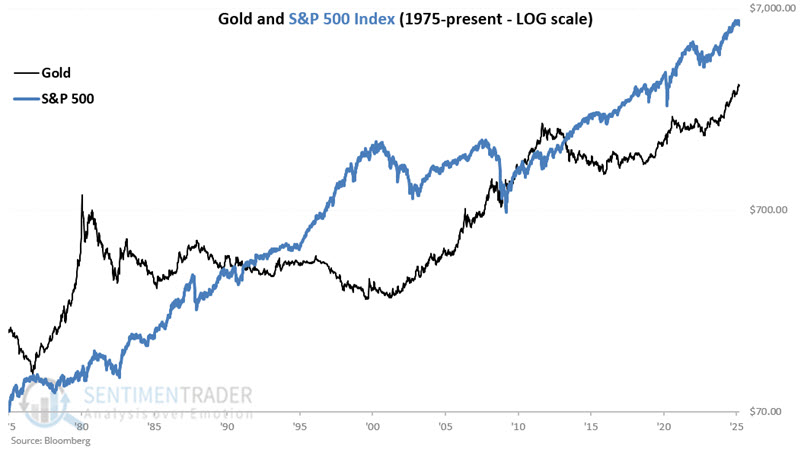
One way to assess the value of gold is to ask, "How valuable is it relative to another asset?" The most obvious candidate is the stock market. So, let's examine the price of gold relative to the S&P 500's performance. For our test, we use weekly data for gold bullion and the S&P 500 Index starting in the mid-1970s, when the price of gold was no longer fixed.
The chart below displays price action for gold and the S&P 500 on a logarithmic scale since 1975.
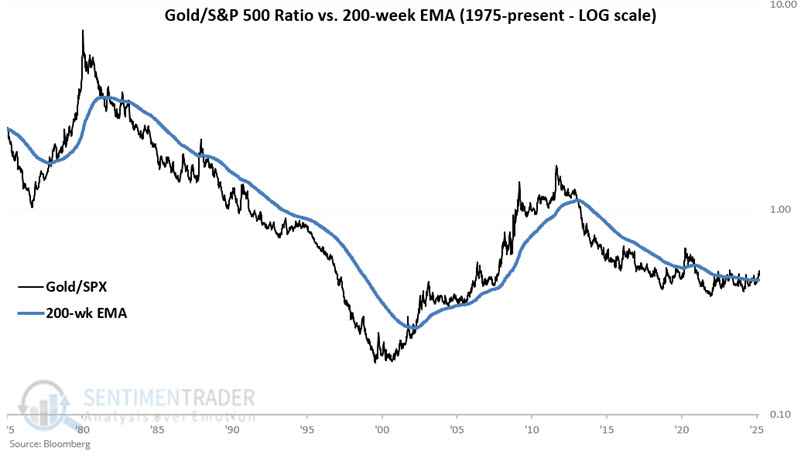
The chart below displays the ratio of gold divided by SPX each week (black line) and a 200-week exponential moving average of the ratio (blue line). When the black line is above the blue line, we state that "gold is outperforming," and when it is below the blue line, we state that "gold is underperforming."
It can be pretty apparent whether gold is outperforming or underperforming for long periods. At other times - especially recently - there can be whipsaws (i.e., repeated movements by the ratio above and below the moving average). The chart below zooms in on the period starting in 2022.
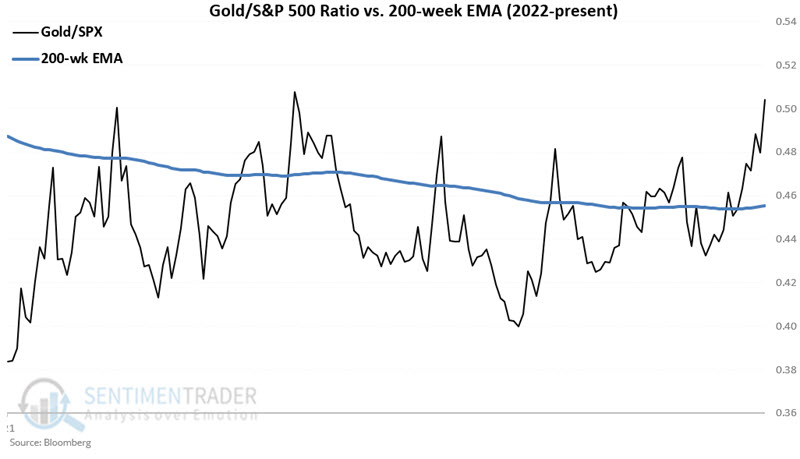
In the chart above, we can count eight separate occasions starting in 2022 when the ratio popped above the EMA but failed to stick. More recently, gold seems to have made more of an extended move relative to stocks. Will this be the time gold follows through to outperform stocks strongly? The reality is that it is impossible to predict. However, this indicator can help to keep you on the right side of this relationship.
Tracking gold based on the ratio relative to its EMA
The chart below displays the hypothetical growth of $1 invested in gold only if the Gold/SPX ratio closed the previous week above its 200-week EMA. From 1976-12-30 through 2025-03-07, $1 grew to $17.87.
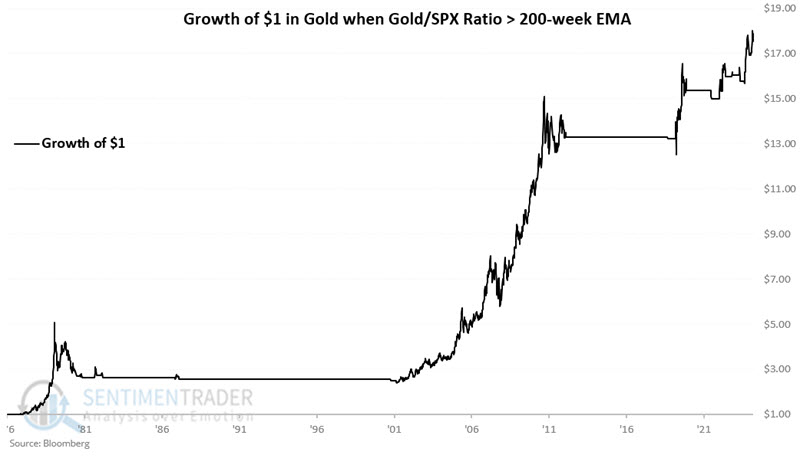
The chart below displays the same information on a logarithmic scale.
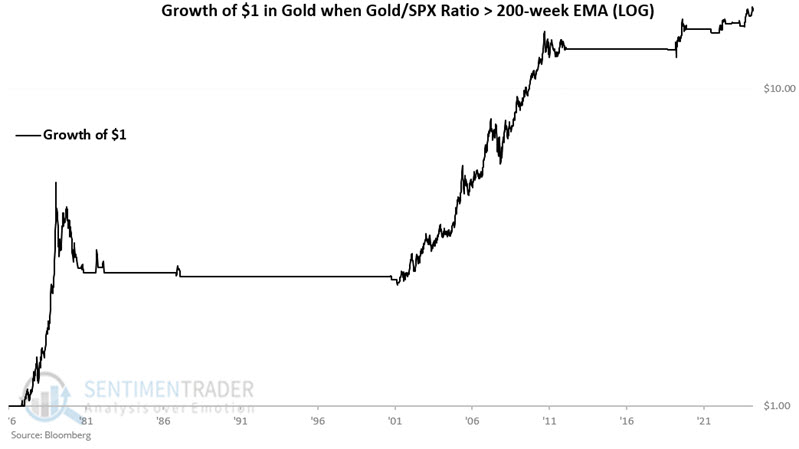
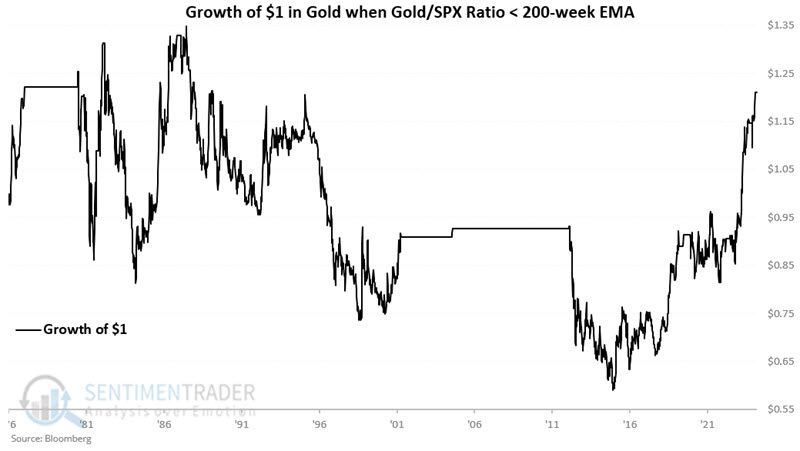
Let's consider the inverse, i.e., holding gold only when the Gold/SPX ratio is below its 200-week EMA.
The chart below displays the hypothetical growth of $1 invested in gold only if the Gold/SPX ratio closed the previous week below its 200-week EMA. From 1976-12-30 through 2025-03-07, $1 grew to $1.21. So, these are not necessarily "bearish " results but are far less favorable and consistent than those shown above.
A closer look at "favorable" periods
The table below displays the percentage gain or loss for gold during "favorable" periods (i.e., when the Gold/SPX Ratio > 200-week EMA).
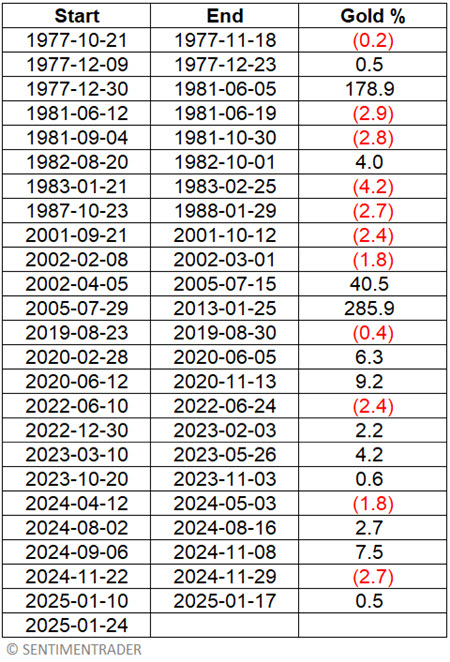
The table below summarizes the results.
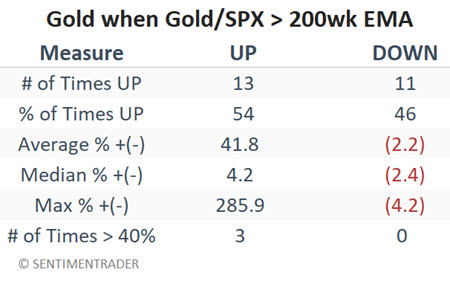
What the research tells us…
To put it as unscientifically as possible, "When gold goes, it really goes," and being on board for the enormous moves is essential to making money via this precious metal. The Gold/SPX Ratio is not a "high probability" model (54% Win Rate). However, there appears to be a tremendous long-term benefit to having at least some exposure to gold (via either gold futures or an ETF such as GDX or IAU) when the Gold/SPX Ratio is above its 200-week moving average.