
What it means when Dumb Money is so smart

The "dumb money" has been right, and they're not shy about letting everyone know about it.
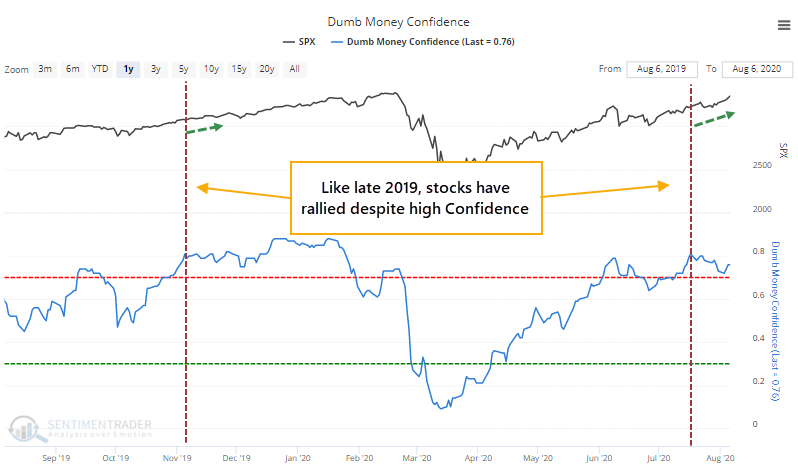
It's a pejorative term, for sure, though we don't mean it that way. It's just shorthand for those investors who use a trend-following strategy. That can be perfectly valid, and they tend to be successful in riding the meat of a trend. Nothing wrong about that whatsoever. The issue arises when they become so confident that they establish their largest long positions AFTER markets have rallied hard, and their smallest after markets have declined.
Only because they tend to be their most exposed near market peaks and least near bottoms, is why they're classified as "dumb money."
The indicators we follow that track these investors reached a true extreme a few weeks ago. Future returns tend to be poor after these traders get this confident, with a very poor risk/reward skew. And yet, three weeks after Dumb Money Confidence hit 80%, the S&P 500 has rallied more than 3.9% while suffering a loss of only -0.3% on a closing basis. This is similar to late 2019.
Historically, future returns were decent after high Dumb Money Confidence failed to see much weakness over the next three weeks.
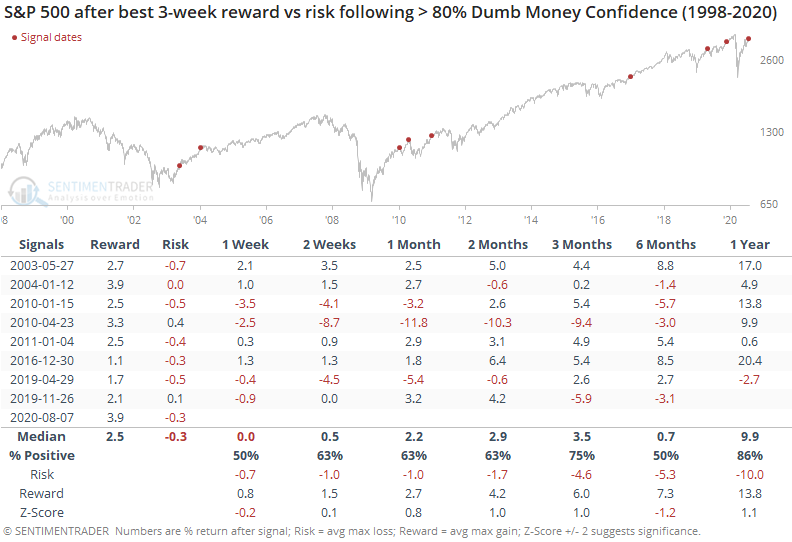
This wasn't an excuse to abandon all caution, though. Between 1-3 months later, three times the S&P showed no losses, while five times it suffered a loss on one of those time frames. Six months later, the S&P's median return was well below random.
Because optimism has been high, and some of our studies have had a negative tilt, the Risk Level has been elevated.
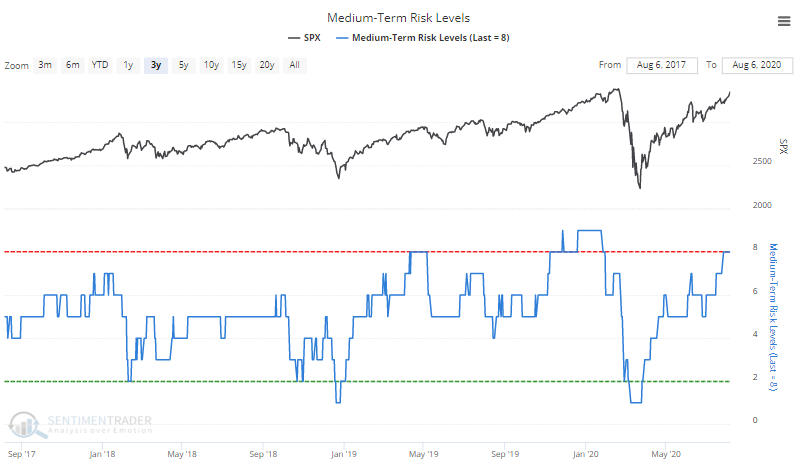
It's been at 8 since July 27, and yet stocks have continued to rally, so it failed to lead to immediate weakness.
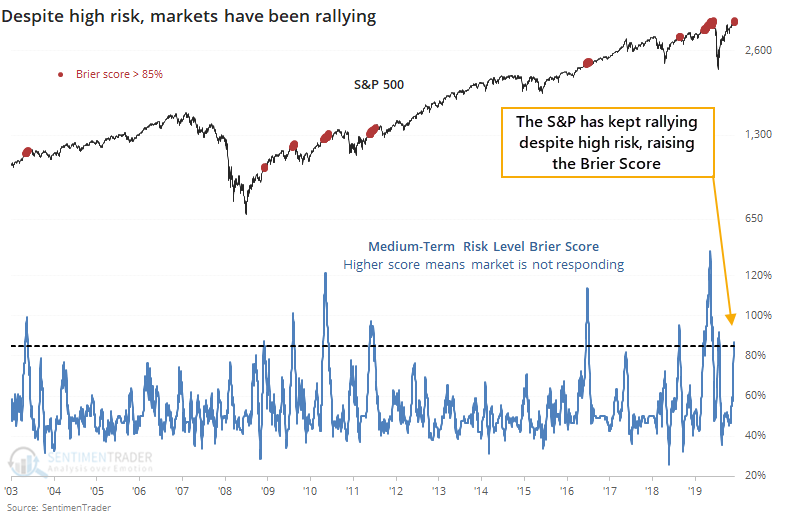
There is a way to quantify failure called the Brier Score. It looks at predictions versus outcomes, with a higher Score meaning worse predictions.
We looked at this when our risk level seemed to be failing in February 2017 and again in December 2019. The conclusion is usually that by the time markets have levitated beyond the typical and people begin doubting the indicators, sentiment has shifted so far that it can't be sustained.
In recent days, the Brier Score for the Risk Level has moved above 85%, meaning that it has failed to lead to the predicted outcomes. It's not as high as some previous spikes but is rapidly getting there.
When stocks have rallied despite high risk to this kind of degree, they did have a tendency to see some shorter-term follow-through, with a continued emphasis on low risk and high reward.
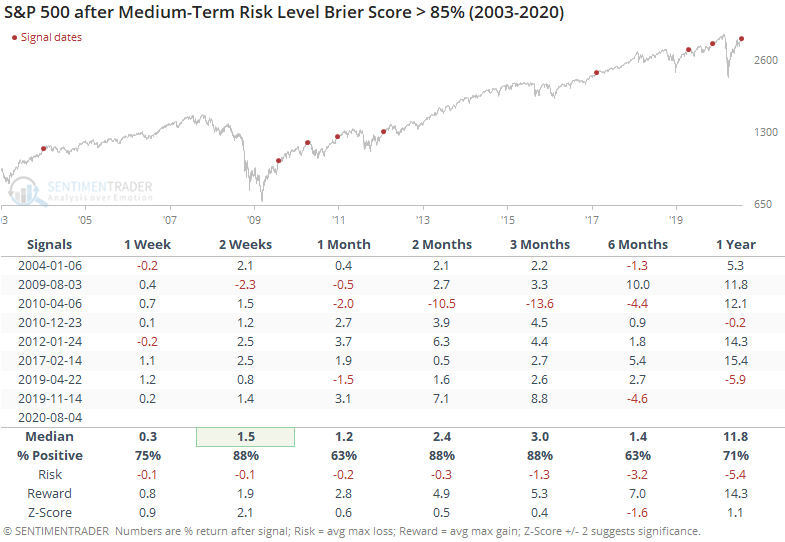
This is one of those times when stats don't really give the full picture. Simply eyeballing the chart shows us that except for August 2009 (recovery from the financial crisis) and February 2017 (one of the "creepiest" uptrends in market history), at some point the S&P gave back its gains, if only temporarily.
We spend a lot of time looking at failures in our indicators and models. It's not navel-gazing or some kind of sick obsession with self-flagellation. But instead of pretending that they don't exist and everything is perfect, looking at failures can give excellent clues as to whether the market environment has changed.
Maybe it has. Like 2009, we're recovering from a massive dislocation with even more massive breadth thrusts, recoveries, and trend changes. Longer-term, like 6-12 months, these have strongly suggested higher prices since they triggered from March through May. Shorter-term, on a multi-week to multi-month time frame, there have been many more warnings, and those have failed. Based on the evidence, these failures don't mean none of this works anymore, only that the consequences may be delayed. It would be extremely rare for there to be no consequences at all.