Data &
Technology
Research
Reports
Report Solutions
Reports Library
Actionable
Strategies
Free
Resources
Simple Backtest Calculator
Simple Seasonality Calculator
The Kelly Criterion Calculator
Sentiment Geo Map
Public Research Reports
Free Webinar
Pricing
Company
About
Meet Our Team
In the News
Testimonials
Client Success Stories
Contact
Log inLoginSign up
< BACK TO ALL REPORTS

What Happens When Oil Prices Show Historic Momentum

Jason Goepfert
2021-10-22
Crude oil prices have held above their 10-day moving average for over a month, one of the longest streaks in nearly 40 years.

Oil prices have been on a historic run.

Whatever your opinion is about the reasons for its rise, the implications for consumers, or the likelihood of the rally continuing, we should appreciate just how much momentum has entered the market.

Crude oil has now closed above its 10-day moving average for 21 consecutive days, a full month. The chart below shows that the streak has surpassed 21 days four times since May 2020. The commodity's ability to hold above its short-term moving average looks similar to the period between 2004-06, the last secular bull market environment for oil.

Crude oil has been above its moving average for a month

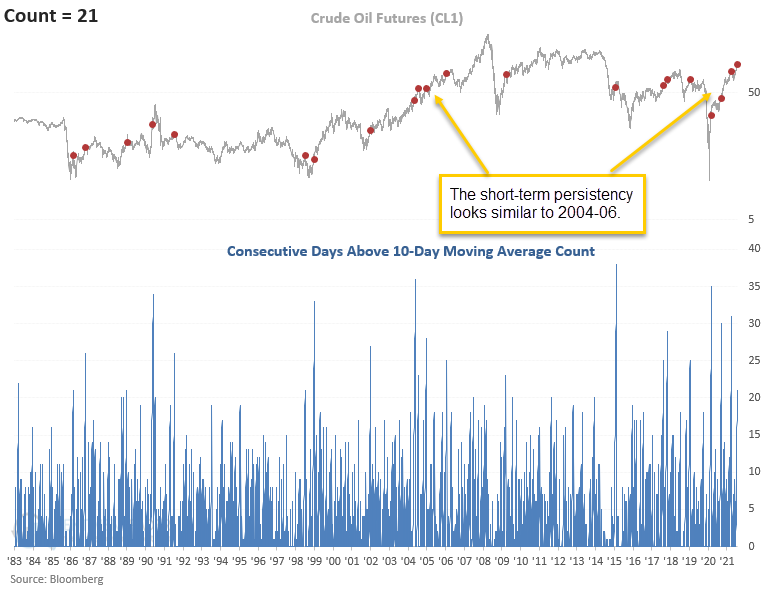
After similar streaks above its moving average, short to intermediate-term forward returns in oil were weak when compared to historical averages. Even during secular bull markets, corrections should be expected when conditions get stretched.

Out of 20 signals since 1983, only 7 showed a positive return over the next month, and the average drawdown of -4.7% was above the average maximum gain.


What else we're looking at

  • Full returns after runs above its 10-day moving average in oil
  • How returns were impacted when oil was trading at a new high
  • Looking at returns after a long run above oil's long-term moving average
  • Using the copper/gold ratio to assess the probability of an imminent recession

Stat box

With all the excitement over bitcoin ETFs, shares outstanding in the GLD gold fund have continued to dwindle and are now down to 336 million shares, the lowest since April 2020.

Etcetera

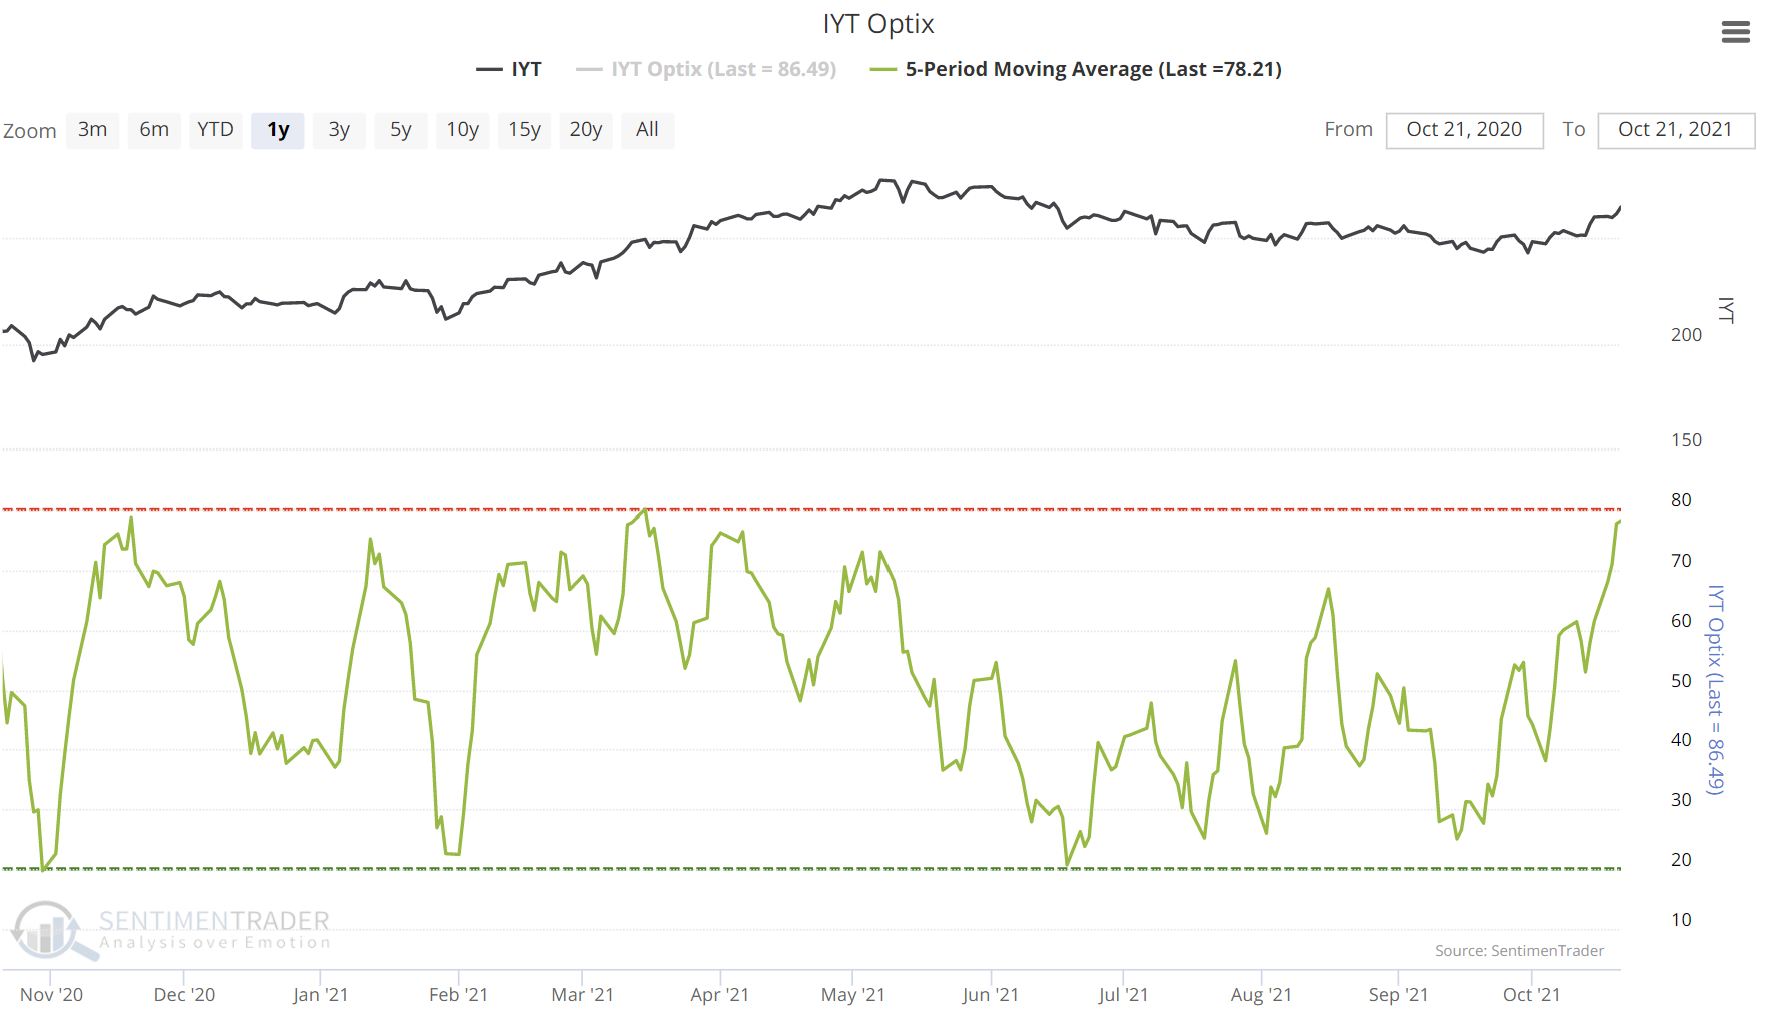
Sentiment is moving higher. Optimism toward the stocks of companies that move stuff for people in the U.S. has soared in recent days. The 5-day average Optimism Index on IYT has crossed 78%, the 3rd-highest level of the past year.

Transports are seeing high optimism

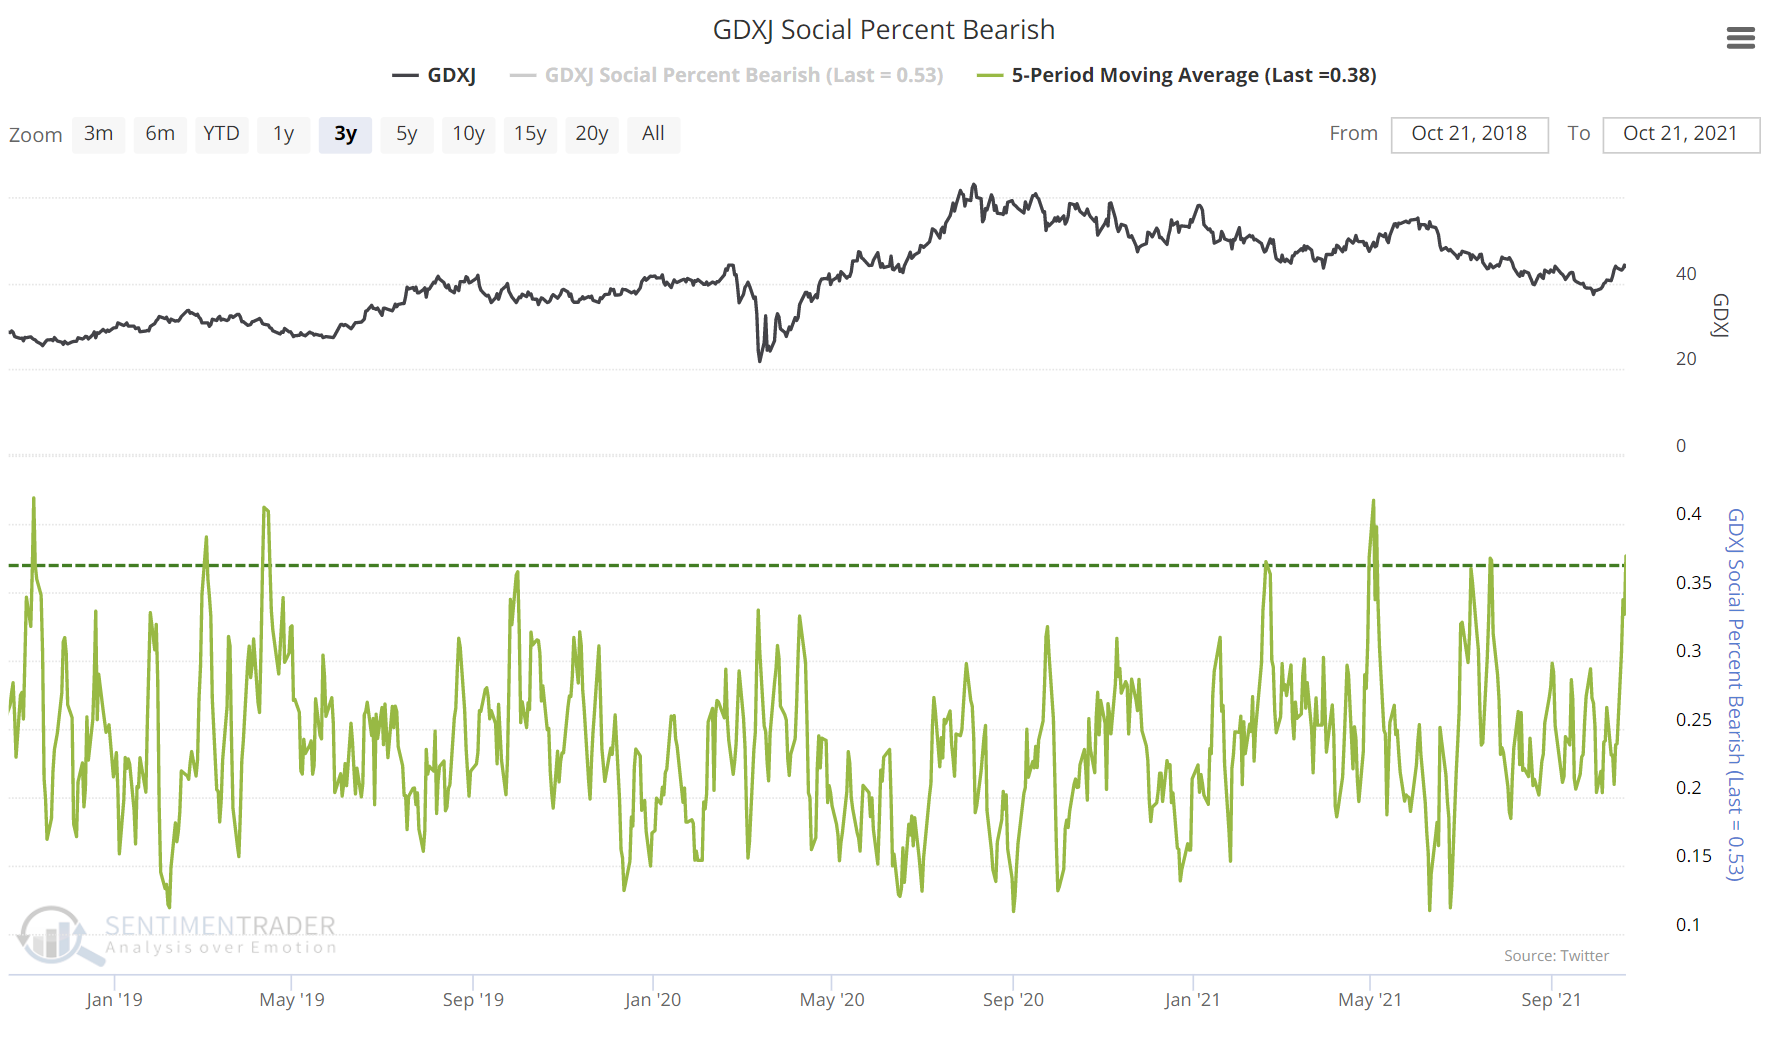
Social pariah. An analysis of sentiment among social media users shows that 38% of tweets about junior gold mining stocks have a negative tone over the past week, among the highest levels in 3 years.

Social sentiment on gold miners is pessimistic

DATA &
TECHnologies
IndicatorEdge
‍
BackTestEdge
‍
Other Tools
‍
DataEdge API
RESEARCH
reports
Research Solution
‍
Reports Library
‍
actionable
Strategies
Trading Strategies
‍
Smart Stock Scanner
‍
FREE
RESOUrCES
Simple Backtest
Calculator
Simple Seasonality
Calculator
The Kelly Criterion
Calculator
Sentiment Geo Map
‍
Public Research Reports
‍
Free Webinar
COMPANY
‍
About
‍
Meet our Team
‍
In the News
‍
Testimonials
‍
Client Success Stories
Pricing
Bundle pricing
‍
Announcements
‍
FAQ
© 2024 Sundial Capital Research Inc. All rights reserved.
Setsail Marketing
TermsPrivacyAffiliate Program
Risk Disclosure: Futures and forex trading contains substantial risk and is not for every investor. An investor could potentially lose all or more than the initial investment. Risk capital is money that can be lost without jeopardizing ones’ financial security or life style. Only risk capital should be used for trading and only those with sufficient risk capital should consider trading. Past performance is not necessarily indicative of future results.

Hypothetical Performance Disclosure: Hypothetical performance results have many inherent limitations, some of which are described below. No representation is being made that any account will or is likely to achieve profits or losses similar to those shown; in fact, there are frequently sharp differences between hypothetical performance results and the actual results subsequently achieved by any particular trading program. One of the limitations of hypothetical performance results is that they are generally prepared with the benefit of hindsight. In addition, hypothetical trading does not involve financial risk, and no hypothetical trading record can completely account for the impact of financial risk of actual trading. for example, the ability to withstand losses or to adhere to a particular trading program in spite of trading losses are material points which can also adversely affect actual trading results. There are numerous other factors related to the markets in general or to the implementation of any specific trading program which cannot be fully accounted for in the preparation of hypothetical performance results and all which can adversely affect trading results.

Testimonial Disclosure: Testimonials appearing on this website may not be representative of other clients or customers and is not a guarantee of future performance or success.