Ultimate guide to the Hindenburg Omen
The Hindenburg Omen is an extremely useful technical indicator that when triggered, can predict stock market pullbacks, corrections, and crashes. It looks for "breadth divergences", which frequently occur before stock market declines. And while the name may sound funny (it's named after the Hindenburg disaster in 1937), data proves that this indicator is very accurate in sending bearish predictions for the stock market. In this post you'll discover:
- What is the Hindenburg Omen and what does it mean for stocks
- How is this indicator calculated
- Skepticism towards the Hindenburg Omen
- How useful is the Hindenburg Omen? No guessing. Just data and facts
- Where can you get regular updates for this indicator
What is the Hindenburg Omen
The Hindenburg Omen is used as a bearish indicator to predict declines in the stock market. When "triggered", this indicator predicts that the stock market will make a meaningful pullback or correction within the next 3 months.
This indicator is based on the logic that a lot of stock market declines are preceded by "breadth divergences".
- A healthy stock market rally (one in which a crash is unlikely) occurs when most stocks within an index/exchange all go up together.
- An unhealthy stock market rally (one in which a crash is likely) occurs when some stocks within the index/exchange are going up while other stocks are falling, even though the stocks that are going up temporarily overpower the stocks that are falling. This indicates a lack of participation in the stock market rally. With more and more stocks not joining the rally, breadth is weak, which suggests that the stock market's rally may falter soon.
If you can see a "breadth divergence" while the stock market is going up, then you can predict a crash. This is exactly what the Hindenburg Omen does - look for breadth divergences.
When the stock market is exhibiting a "breadth divergence", the Hindenburg Omen is triggered, which means that the stock market will probably decline soon.
This indicator was developed by Jim Miekka in the 1990s, who named this after the Hindenburg disaster of May 1937 in which the airship Hindenburg caught fire and struck disaster, ending the airship industry. While this indicator may have a funny name, it is a very serious and useful technical pattern that has a good track record. Focus on the logic of the indicator and not its name. Later on in this post we'll use data to see just how useful the Hindenburg Omen really is.
How to calculate the Hindenburg Omen
So how do we know what counts as a "breadth divergence" according to the Hindenburg Omen? Afterall, this indicator is precise - it's not based on "guessing" what counts as a "breadth divergence".
There is no "official" calculation for the Hindenburg Omen. But the one that's commonly used (which we use) is as follows:
- Criteria #1: the S&P 500 must be above its 50 day moving average. In order words, the stock market must be in an uptrend.
- Criteria #2: New 52 week highs AND new 52 week lows on the exchange (e.g. NYSE or NASDAQ) must be greater than 2.8% of all advancing and declining issues. In other words, the stock market must be "split".
- Criteria #3: The McClellan Oscillator is negative.
*Some traders might use slightly different thresholds (e.g. 2.2% instead of 2.8%), but this is what we've found to be most useful.
When the signal triggers, it highlights a "split" market in which participation is unhealthy. Perhaps there is trouble brewing beneath the surface, with the smart money selling some stocks even though the overall index is going up.
When all 3 criteria are satisfied, the Hindenburg Omen is "triggered", so traders should turn bearish. One signal is already bearish for the stock market. But if a cluster of signals are triggered together (e.g. triggered yesterday, 3 days before, 2 weeks ago, and also 3 weeks ago), then that is even more worrisome for the stock market's rally.
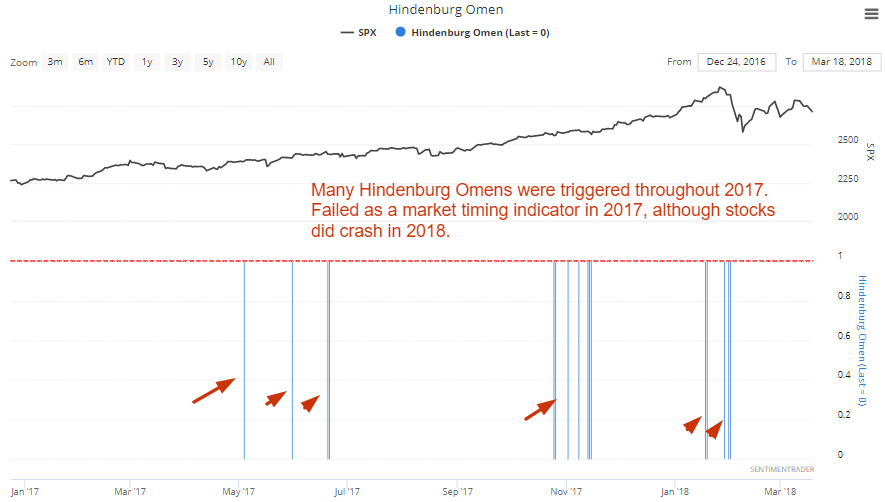
Traditionally, the signal is cancelled after 30 days or if the Oscillator turns positive again. Here's what these signals look like on our charting software:
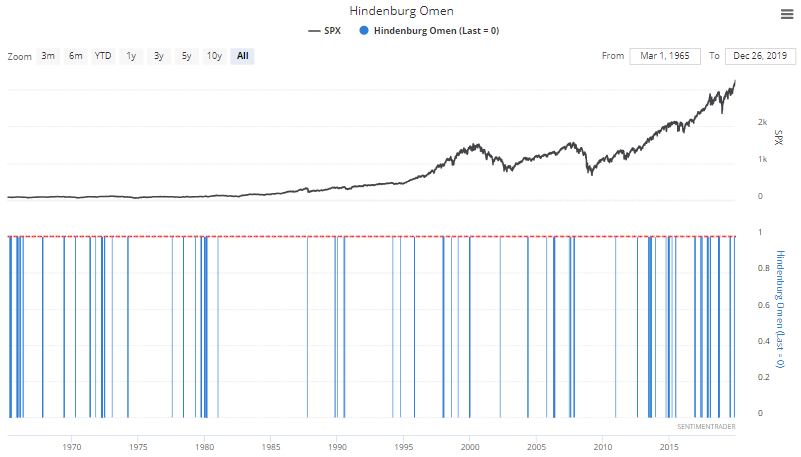
The blue bars represent whether or not the Hindenburg Omen has been triggered on any given date.
- 1 = Hindenburg Omen was triggered
- 0 = Hindenburg Omen wasn't triggered
Skepticism towards the Hindenburg Omen
Many traders are skeptical about this indicator. In fact, whenever the Hindenburg Omen is triggered, a bunch of journalists tend to write articles about how useful it is while other journalists poo-poo the indicator and tell their readers to ignore its warnings.
For starters, the Hindenburg Omen has a funny name, which doesn't lend credibility to it. But names shouldn't matter - it's just a marketing gimmick. This indicator would "sound" a lot smarter if it was called "The Breadth Divergence While Stocks are In an Uptrend" indicator.
But there are more legitimate concerns:
- Some traders are concerned that this indicator may be skewed by international stocks, which are more prevalent on U.S. stock exchanges these days. E.g. if many stocks are making new highs while others are making new lows, but all the ones that are going up are U.S. stocks while the ones falling are foreign stocks, some traders argue that this doesn't truly show "breadth divergence" in the U.S. stock market. In other words, the Hindenburg Omen is calculated based on U.S. stock exchanges (i.e. NYSE and NASDAQ). But as time goes on, U.S. stock exchanges increasingly no longer just focus on the U.S. stock market.
- Skeptics also argue that the indicator is skewed by small cap stocks and bond funds.
Regardless of the debate, one thing is for certain. The Hindenburg Omen works. Now of course it doesn't work 100% of the time - there is no such thing as a Holy Grail in financial markets. But its overall track record is pretty good. Here's the data to prove it.
Does the Hindenburg Omen actually work? Here's the data and proof
Our Backtest Engine is a great tool which allows users to test and see exactly how well technical indicators work. No more guessing, BS, or any of the hype that's so common on the internet. Just hard data and facts. So let's apply it to the Hindenburg Omen.
We created 2 Hindenburg Omen indicators: one for the NYSE and one for the NASDAQ.
Hindenburg Omen for the NYSE
Using our Backtest Engine (backtesting software), we can see exactly what the S&P 500 did after the Hindenburg Omen was triggered on the NYSE.
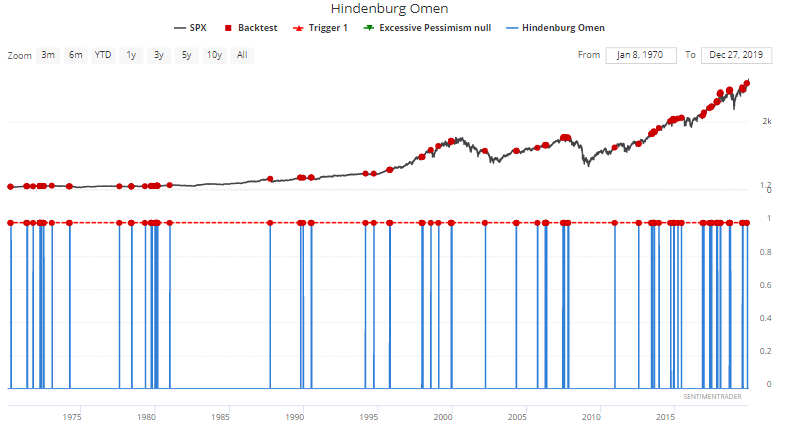

As you can see, the S&P 500 (U.S. stock market index) is usually quite weak over the next 1-3 months. Risk:reward favors the bears, and the stock market falls more often than it rallies. This is as we suspected - a breadth divergence (Hindenburg Omen signal) leads to a decline in the stock market.
Here are some cases in which the Hindenburg Omen successfully predicted a decline in the S&P 500.
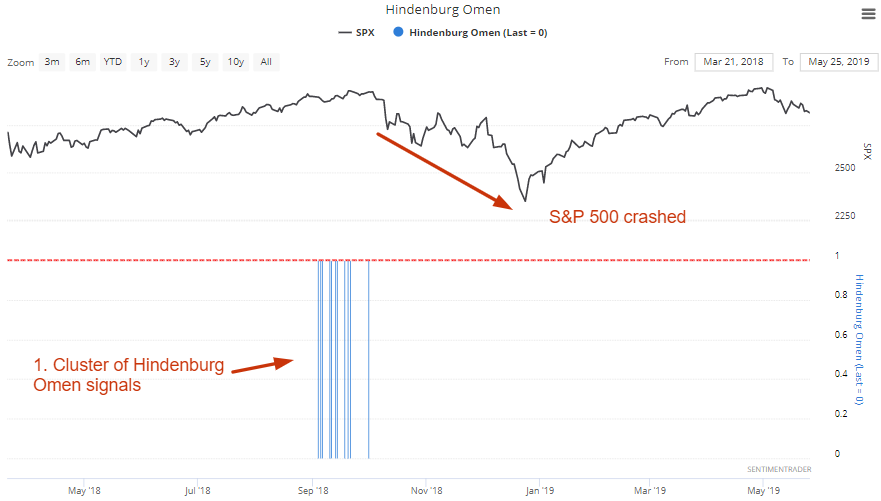
September 2018:
A massive cluster of Hindenburg Omens were triggered throughout September 2018. Even though the overall U.S. stock market index was making new all time highs, many stocks were not participating in the rally. The stock market promptly began a 3 month correction in which the S&P 500 fell approximately -20%
October 1987 crash:
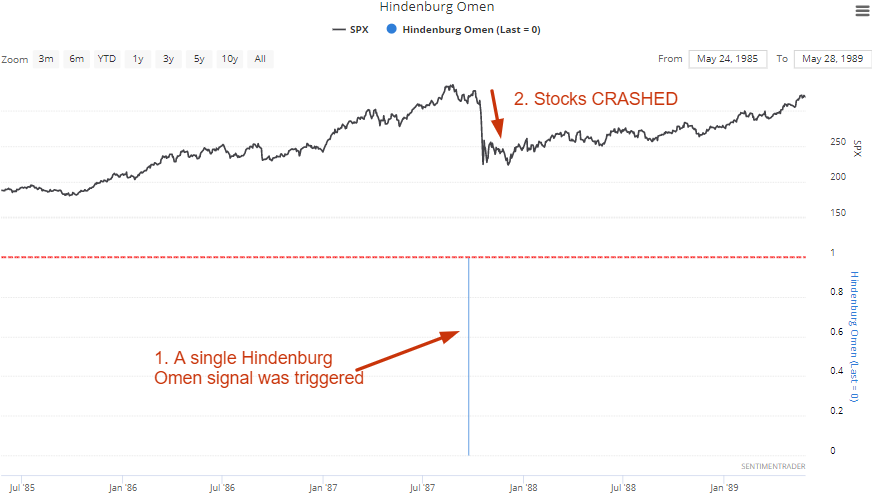
With the stock market still close to an all-time high and while many stocks were still rallying, a large number of stocks were already falling significantly. As a result, a single Hindenburg Omen was triggered. As they say, the rest is history. The U.S. stock market soon witnessed its largest 1 day crash in history.
Here's a specific year in which the Hindenburg Omen repeatedly failed to successfully predict a pullback/correction.
2017:
Multiple Hindenburg Omen signals were triggered throughout 2017. And while this was "eventually" followed by the stock market's crash in early-2018, it's hard to say that this bearish signal was a success. The first bearish Omen was triggered in mid-2017. Even after the stock market had crashed in early-2018, the S&P 500 was far higher than where it was in mid-2017.
Hindenburg Omen for the NASDAQ
We can run the same analysis on the NASDAQ and ask the same question: what happened next to the NASDAQ Composite when the NASDAQ Hindenburg Omen was triggered?
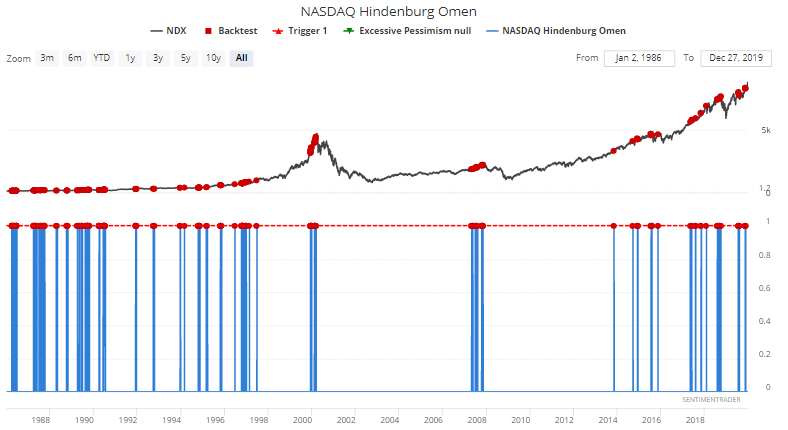

This wasn't as immediately bearish for the NASDAQ over the next month, possibly because the NASDAQ is more prone to "animal spirits" in which it overshoots in the short term. But with that being said, the NASDAQ's returns over the next 3-6 months were still more bearish than bullish.
*Keep in mind that stocks go up more often than they go down. "More bearish than random" doesn't have to mean that the stock market goes down more than 50% of the time - it means that the stock market (under scenario XYZ) goes up less than it does on any average random day.
How to make the Hindenburg Omen more useful
Like any good technical indicator, the Hindenburg Omen can be made more useful if you combine it with other technical indicators. For example, a Hindenburg Omen that's triggered while the market is overbought (RSI > 70) is often a more effective bearish signal than just a Hindenburg Omen on its own. Here are some examples of useful combinations of the Hindenburg Omen:
- Hindenburg Omen + overbought (RSI > 70)
- Hindenburg Omen + low Put/Call ratio
- Hindenburg Omen + high stock market sentiment
- Hindenburg Omen + excessive equity fund inflows
Moreover, a single Hindenburg Omen signal on its own is somewhat bearish. But if you see a CLUSTER of Hindenburg Omen signals (e.g. 5 signals in the past month), that's a more ominous bearish sign for the stock market.
How to see this indicator calculated in real time
The Hindenburg Omen is not easy to calculate in real-time, and many charting services don't offer this indicator (which is a shame, considering how useful this is). With that being said, you can access this indicator in real-time by subscribing to our SentimenTrader service. Don't worry about the calculations - we've already done this.
Conclusion
The Hindenburg Omen - a bearish sign of breadth divergence - is a useful technical indicator for predicting stock market pullbacks, corrections, and crashes. It doesn't always successfully predict one - some bearish predictions don't pane out. But that's just the nature of successful trading. Successful trading is about having an edge, and no edge works 100% of the time. Even if you have an 80% chance of success, 1 in 5 attempts will fail.
As we've demonstrated with the data above, the Hindenburg Omen successfully predicts market declines more often than not. It is a useful technical indicator that every trader should consider following, particularly if you are interested in short term or medium term trading.


