Products
SentimenTrader Trading Tools
‍
Backtest Engine
My Trading Toolkit
Correlation Analysis
Seasonality
Indicators & Data API
‍
Proprietary Indicators & Charts
Market Data API
Strategies & Scanner
‍
50+ Trading Strategies
Smart Stock Scanner
Research Reports
‍
Research Solutions
Reports Library
Free Resources
Simple Backtest Calculator
Simple Seasonality Calculator
The Kelly Criterion Calculator
Sentiment Geo Map
Public Research Reports
Pricing
Company
About
In the News
Testimonials
Client Success Stories
Contact
Log inLoginSign up
< BACK TO ALL REPORTS

Three "all clear" signals to watch for

Jay Kaeppel
2022-10-05
Being in cash during a bear market is excellent. But figuring out when to get back in can be challenging for many investors. The three indicators discussed in this piece offer confirmation that the worst is over.

Key points:

  • If you were able to sit out part of the stock market decline, the good news is that you likely preserved some capital
  • The bad news is that you now have to decide when to get back in
  • A few specific indicators do an excellent job of telling us when the worst is over

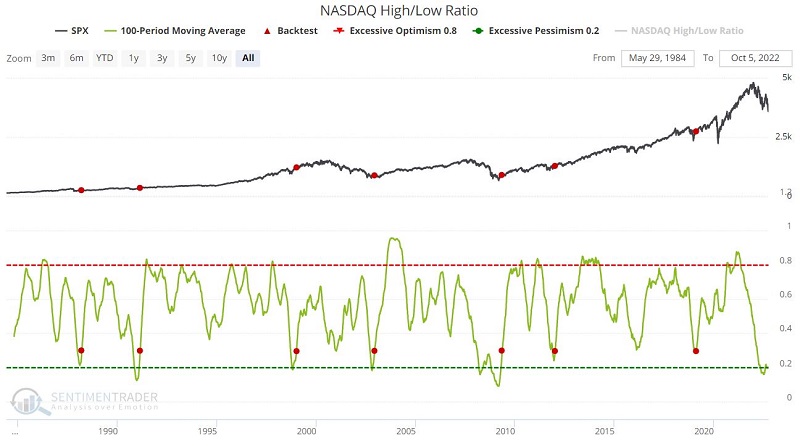
Nasdaq new highs and new lows should turn higher

During a bear market, the number of stocks making new 52-week lows typically outnumbers the number of stocks making new 52-week highs, often by a wide margin. To measure this, we follow the ratio of Nasdaq stocks making new highs divided by Nasdaq stocks making new highs and new lows each day. During a significant bear market, this number can fall to a significantly low level.

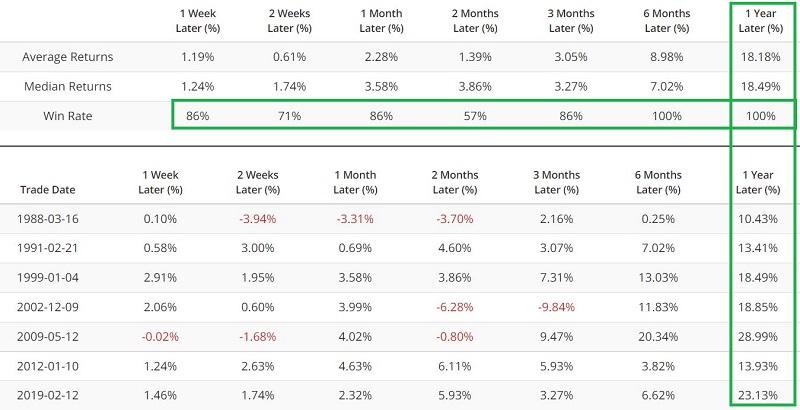
To identify an "all clear" signal, you can look for the 100-day moving average to rise above 0.29. In other words, the 100-day average must drop below 0.29 and then climb back above it. The chart and table below display the signals and subsequent S&P 500 Index performance.

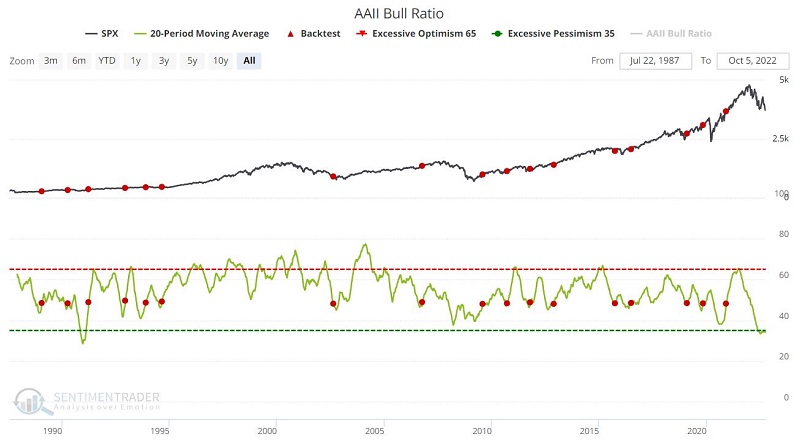
Bullish versus bearish sentiment should start to rise

Human nature being what it is, the investing public typically becomes more bearish the longer a bear market lasts and the more significant the decline.

We use the weekly bullish and bearish readings recorded by the American Association of Individual Investors (AAII) as one measure of investor sentiment. The Bull Ratio is calculated by dividing the bullish percentage by bullish plus bearish percentages. 

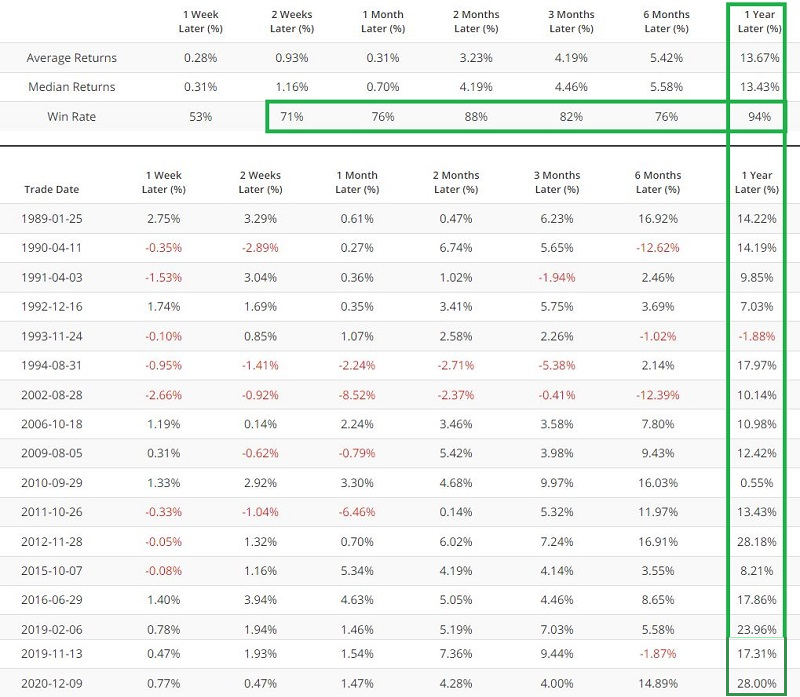
To identify an "all clear" signal, you can look for the 20-week moving average of weekly readings to cross above 48 for the first time in six months. The chart and table below display the signals and subsequent S&P 500 Index performance.

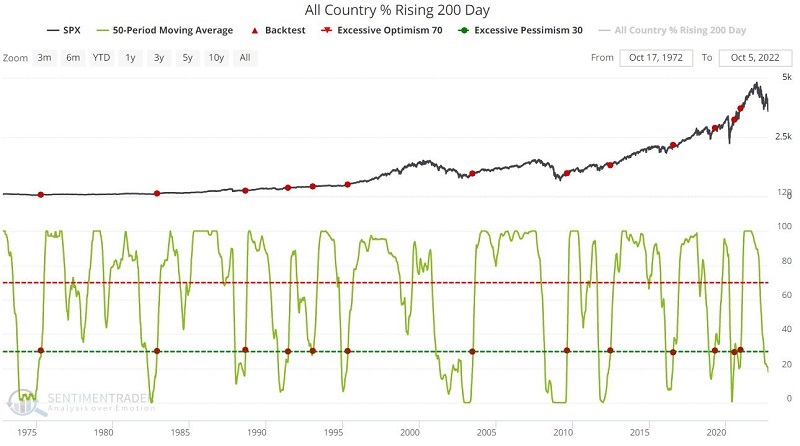
Price trends should start to curl higher

The most crucial arbiter of bullish and bearish trends is price action itself.

A standard definition of a bull market is when a major stock market index is above its 200-day moving average. The trend is confirmed as bullish when the 200-day moving average itself is in an uptrend, meaning today's 200-day moving average level is above its reading on the previous day. 

To measure this, we take a global approach and follow the stock indexes for over 20 countries. We calculate the percentage of these indexes with a rising 200-day moving average. To identify an "all clear" signal, you can look for the 50-day moving average of this weekly percentage to cross above 30 percent. The chart and table below display the signals and subsequent S&P 500 Index performance.

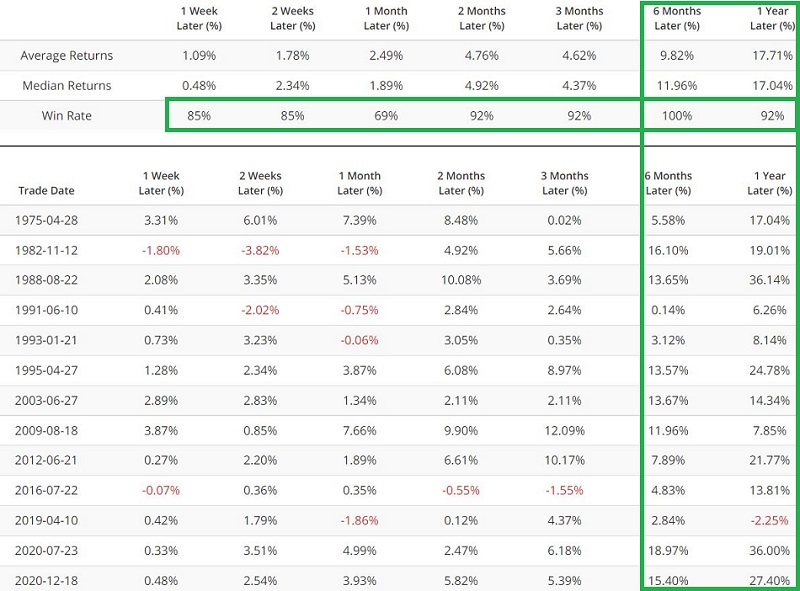
What the research tells us…

None of the above indicators will get you in at the bottom. Some investors will lament that the signals from these indicators are late. But one of the most underappreciated accomplishments in investing is to buy in when the probabilities of an advance - even a continuing advance - are at their highest. When the signals shown above eventually trigger, history suggests that investors can move heavily into the market with high confidence.

PRODUCTS
SentimenTrader
Trading Tools
Indicators & Data API
‍
Strategies & Scanner
‍
Research Reports
FREE
RESOUrCES
Simple Backtest
Calculator
Simple Seasonality
Calculator
The Kelly Criterion
Calculator
Sentiment Geo Map
‍
Public Research Reports
‍
Pricing
Bundle pricing
‍
Announcements
‍
FAQ
COMPANY
‍
About
‍
In the News
‍
Testimonials
‍
Client Success Stories
CONTACT
‍
General Inquiries
‍
Media Inquiries
‍
Financial Professionals Inquiries
‍
© 2025 Sundial Capital Research Inc. All rights reserved.
Setsail Marketing
TermsPrivacyAffiliate Program
Risk Disclosure: Futures and forex trading contains substantial risk and is not for every investor. An investor could potentially lose all or more than the initial investment. Risk capital is money that can be lost without jeopardizing ones’ financial security or life style. Only risk capital should be used for trading and only those with sufficient risk capital should consider trading. Past performance is not necessarily indicative of future results.

Hypothetical Performance Disclosure: Hypothetical performance results have many inherent limitations, some of which are described below. No representation is being made that any account will or is likely to achieve profits or losses similar to those shown; in fact, there are frequently sharp differences between hypothetical performance results and the actual results subsequently achieved by any particular trading program. One of the limitations of hypothetical performance results is that they are generally prepared with the benefit of hindsight. In addition, hypothetical trading does not involve financial risk, and no hypothetical trading record can completely account for the impact of financial risk of actual trading. for example, the ability to withstand losses or to adhere to a particular trading program in spite of trading losses are material points which can also adversely affect actual trading results. There are numerous other factors related to the markets in general or to the implementation of any specific trading program which cannot be fully accounted for in the preparation of hypothetical performance results and all which can adversely affect trading results.

Testimonial Disclosure: Testimonials appearing on this website may not be representative of other clients or customers and is not a guarantee of future performance or success.