Data &
Technology
Research
Reports
Report Solutions
Reports Library
Actionable
Strategies
Free
Resources
Simple Backtest Calculator
Simple Seasonality Calculator
The Kelly Criterion Calculator
Sentiment Geo Map
Public Research Reports
Free Webinar
Pricing
Company
About
Meet Our Team
In the News
Testimonials
Client Success Stories
Contact
Log inLoginSign up
< BACK TO ALL REPORTS

This Small-Cap correction is one of the fastest in history

Jason Goepfert
2021-12-02
Small-Cap stocks suffered a failed breakout and quick correction. There are too many new lows. Commodity investors should watch the Aussie dollar.

Small-Caps' failed breakout

Earlier this month, the small-cap Russell 2000 broke out of a long consolidation. When it's done that before, it had a strong tendency to keep going. While short-term returns were modestly positive, the index showed a positive return 2 months later 16 out of 18 times.

After its latest attempt, it promptly failed. And failed hard.

Within only a few weeks of trading at an all-time high, the Russell is already back into correction territory. This is its first drawdown of more than 10% (rounded) in more than a year. This is the Russell 2000's 4th-fastest correction in its history.

This is one of the fastest-ever corrections for the Russell 2000

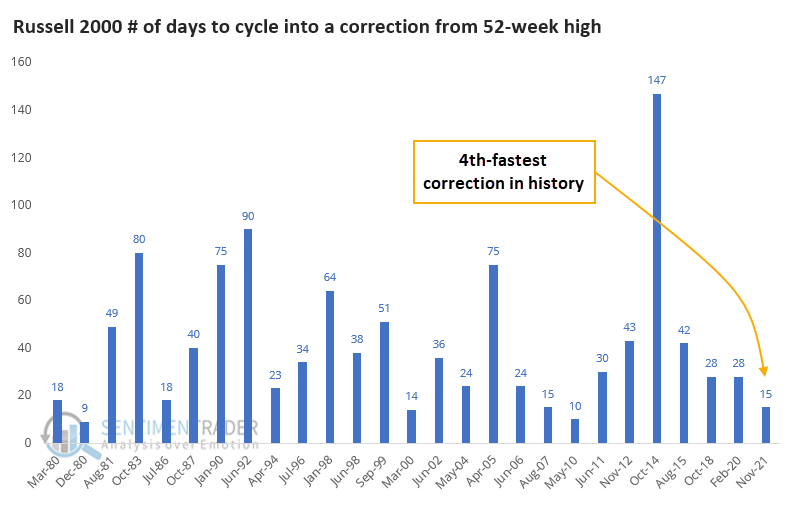
This quick correction is also the Russell's first substantial pullback in a long time. It ends a streak of nearly 300 trading days since it last traded more than 10% below a 52-week high.

Stat box

More than 16% of stocks in the Russell 3000 have dropped more than 20% over the past month. That's the 5th-largest amount in the past 5 years.


Too many new lows

A new signal from a voting member in Dean's TCTM Risk Warning Model registered an alert on Tuesday. 

The model identifies when the percentage of S&P 500 members registering a 252-day low exceeds a certain threshold while the S&P 500 is relatively close to its most recent high. 

New lows are one of the most critical breadth measures to monitor in a bull market, especially long-duration ones. When they expand to current levels with the market near a high, something is amiss with market participation. 

There are too many 52-week lows in the S&P 500

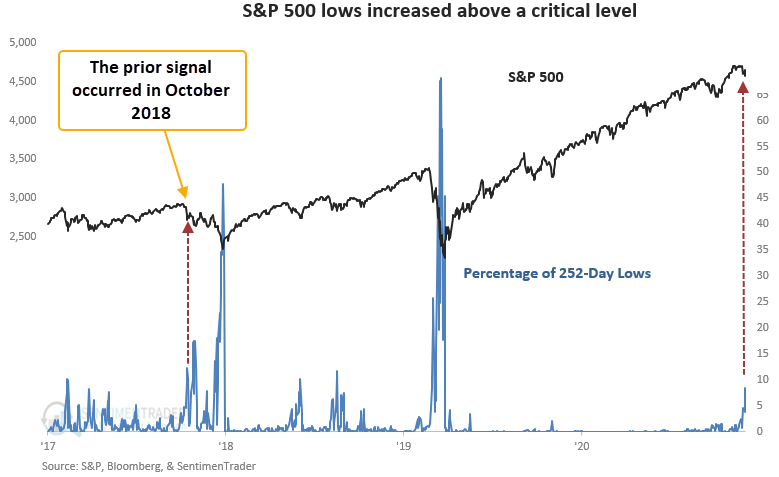
This signal triggered 21 other times over the past 93 years. 

Watch the Aussie

The top clip in the chart below displays a monthly chart of the Australian Dollar with its 24-month moving average. The bottom clip shows the monthly chart of GSG, an ETF that tracks the Goldman Sachs Commodity Index. 

The Aussie dollar as a signal for commodities

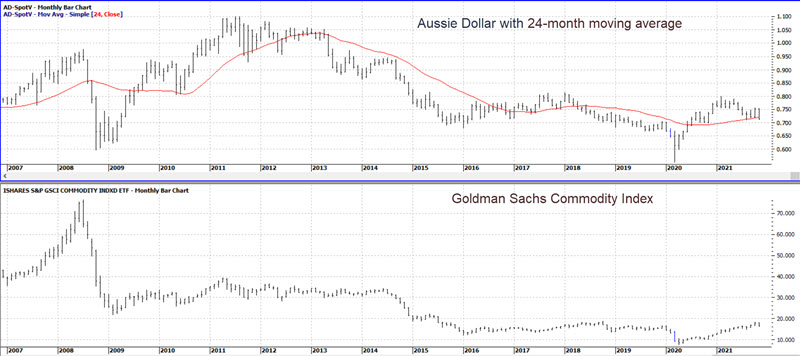
Jay noted that $1 invested in the GSCI only when the Aussie dollar closed the previous month above its 24-month moving average grew to $60.87, a return of +5,987%. That is vastly different than the return generated in commodities when the Aussie was below its average.

DATA &
TECHnologies
IndicatorEdge
‍
BackTestEdge
‍
Other Tools
‍
DataEdge API
RESEARCH
reports
Research Solution
‍
Reports Library
‍
actionable
Strategies
Trading Strategies
‍
Smart Stock Scanner
‍
FREE
RESOUrCES
Simple Backtest
Calculator
Simple Seasonality
Calculator
The Kelly Criterion
Calculator
Sentiment Geo Map
‍
Public Research Reports
‍
Free Webinar
COMPANY
‍
About
‍
Meet our Team
‍
In the News
‍
Testimonials
‍
Client Success Stories
Pricing
Bundle pricing
‍
Announcements
‍
FAQ
© 2024 Sundial Capital Research Inc. All rights reserved.
Setsail Marketing
TermsPrivacyAffiliate Program
Risk Disclosure: Futures and forex trading contains substantial risk and is not for every investor. An investor could potentially lose all or more than the initial investment. Risk capital is money that can be lost without jeopardizing ones’ financial security or life style. Only risk capital should be used for trading and only those with sufficient risk capital should consider trading. Past performance is not necessarily indicative of future results.

Hypothetical Performance Disclosure: Hypothetical performance results have many inherent limitations, some of which are described below. No representation is being made that any account will or is likely to achieve profits or losses similar to those shown; in fact, there are frequently sharp differences between hypothetical performance results and the actual results subsequently achieved by any particular trading program. One of the limitations of hypothetical performance results is that they are generally prepared with the benefit of hindsight. In addition, hypothetical trading does not involve financial risk, and no hypothetical trading record can completely account for the impact of financial risk of actual trading. for example, the ability to withstand losses or to adhere to a particular trading program in spite of trading losses are material points which can also adversely affect actual trading results. There are numerous other factors related to the markets in general or to the implementation of any specific trading program which cannot be fully accounted for in the preparation of hypothetical performance results and all which can adversely affect trading results.

Testimonial Disclosure: Testimonials appearing on this website may not be representative of other clients or customers and is not a guarantee of future performance or success.