Data &
Technology
Research
Reports
Report Solutions
Reports Library
Actionable
Strategies
Free
Resources
Simple Backtest Calculator
Simple Seasonality Calculator
The Kelly Criterion Calculator
Sentiment Geo Map
Public Research Reports
Free Webinar
Pricing
Company
About
Meet Our Team
In the News
Testimonials
Client Success Stories
Contact
Log inLoginSign up
< BACK TO ALL REPORTS

This Led to Declines Every Time in the Past 93 Years

Jason Goepfert
2021-06-28
Despite hitting new highs late last week, fewer than half of S&P 500 stock were trading above their 50-day moving averages.

There is some weird stuff happening under the surface of the market.

Early last week, the percentage of S&P 500 members above their 50-day moving averages had plunged, even while the majority were still above their 200-day averages. That has tended to be a good sign.

But...

The problem is what's happened in recent sessions. Despite a push to new highs in the S&P toward the end of the week, the percentage of its members above their averages barely budged. In terms of divergences, this one is gonzo.

Divergence with S&P 500 members above 50-day average

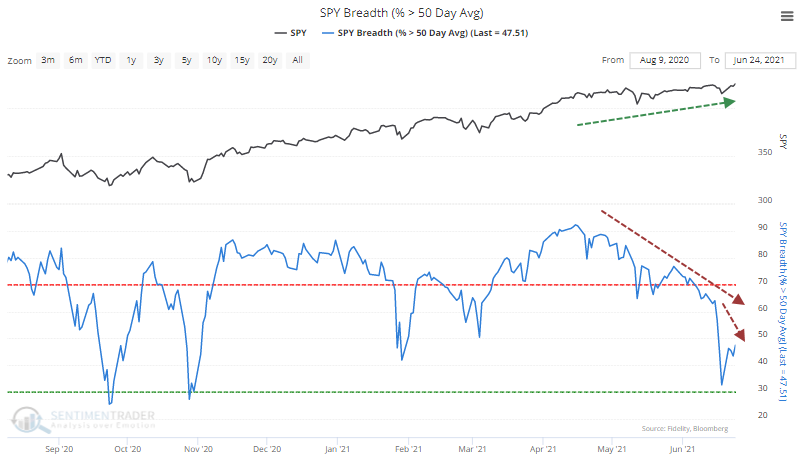
Going back to the mid-1920's, there have only been a handful of dates with breaks like this. It happened in 1929, 1959, 1963, 1972, 1998, and 1999, and all of them ended up preceding losses in stocks.

Several more days (or weeks) with this kind of behavior should trigger all kinds of risk warnings, the types of things we've been watching for since speculation reached its heights in February.

What else we're looking at

  • More details about what happens with new highs with lower participation
  • A different look at the percentage of companies trading around their 50-day averages


Stat box

With recent declines, 90% of gold mining stocks are now mired in bear markets. Since the GDX fund bottomed in 2018, secondary bottoms triggered when 100% of miners fell into bear markets. We update this figure every day for premium members.

Etcetera

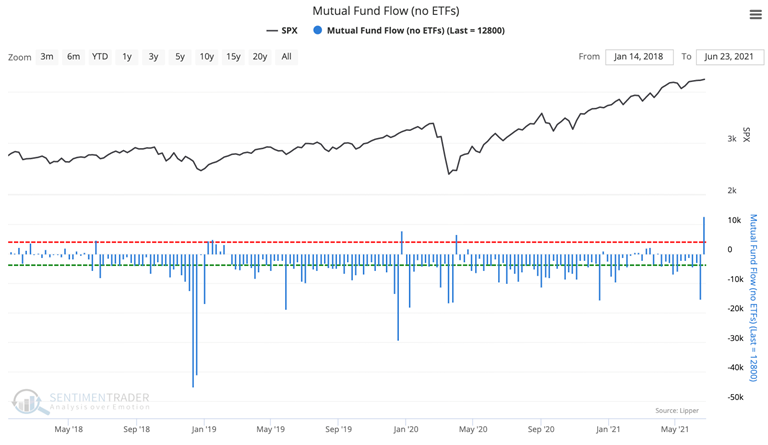
Fund flood. According to Lipper, equity mutual funds pulled in nearly $13 billion in assets in a single week recently. That's the 2nd-largest inflow in more than 15 years.

mutual fund flow

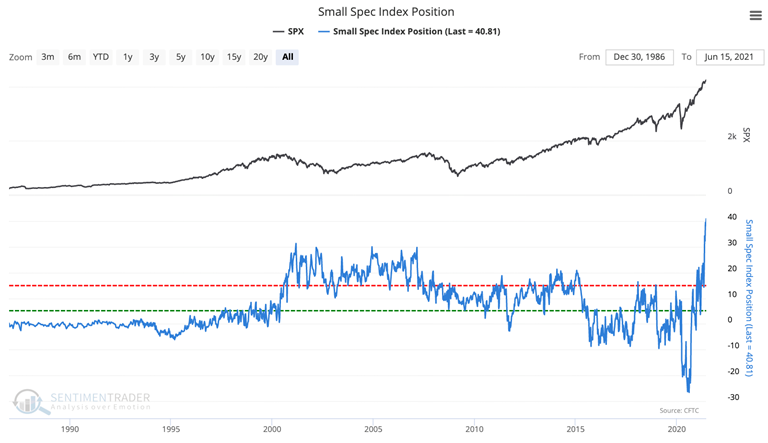
Small spec-big gains. Nonreportable traders, otherwise known as small speculators, held more than $40 billion in major equity index futures, the largest amount ever, as of mid-June. In the latest week, they drastically reduced those positions.

small speculator equity index position

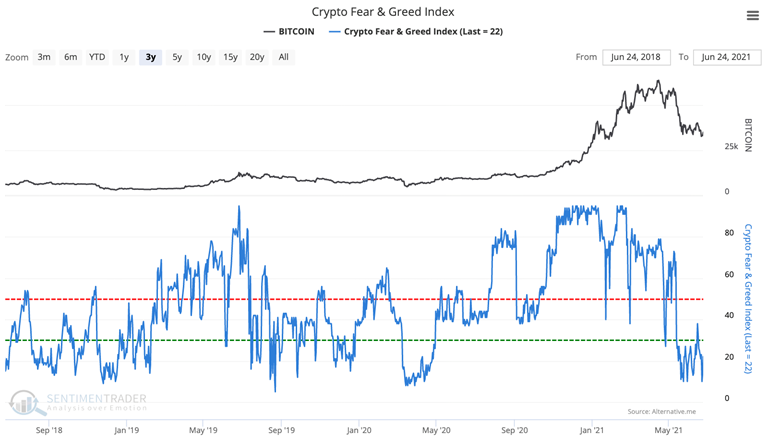
Crunch time. The Crypto Fear and Greed Index has stayed below 40 for the past month. The last time this happened, when sentiment finally turned it preceded a year-long rally in bitcoin and other crypto assets.

crypto fear & greed sentiment

DATA &
TECHnologies
IndicatorEdge
‍
BackTestEdge
‍
Other Tools
‍
DataEdge API
RESEARCH
reports
Research Solution
‍
Reports Library
‍
actionable
Strategies
Trading Strategies
‍
Smart Stock Scanner
‍
FREE
RESOUrCES
Simple Backtest
Calculator
Simple Seasonality
Calculator
The Kelly Criterion
Calculator
Sentiment Geo Map
‍
Public Research Reports
‍
Free Webinar
COMPANY
‍
About
‍
Meet our Team
‍
In the News
‍
Testimonials
‍
Client Success Stories
Pricing
Bundle pricing
‍
Announcements
‍
FAQ
© 2024 Sundial Capital Research Inc. All rights reserved.
Setsail Marketing
TermsPrivacyAffiliate Program
Risk Disclosure: Futures and forex trading contains substantial risk and is not for every investor. An investor could potentially lose all or more than the initial investment. Risk capital is money that can be lost without jeopardizing ones’ financial security or life style. Only risk capital should be used for trading and only those with sufficient risk capital should consider trading. Past performance is not necessarily indicative of future results.

Hypothetical Performance Disclosure: Hypothetical performance results have many inherent limitations, some of which are described below. No representation is being made that any account will or is likely to achieve profits or losses similar to those shown; in fact, there are frequently sharp differences between hypothetical performance results and the actual results subsequently achieved by any particular trading program. One of the limitations of hypothetical performance results is that they are generally prepared with the benefit of hindsight. In addition, hypothetical trading does not involve financial risk, and no hypothetical trading record can completely account for the impact of financial risk of actual trading. for example, the ability to withstand losses or to adhere to a particular trading program in spite of trading losses are material points which can also adversely affect actual trading results. There are numerous other factors related to the markets in general or to the implementation of any specific trading program which cannot be fully accounted for in the preparation of hypothetical performance results and all which can adversely affect trading results.

Testimonial Disclosure: Testimonials appearing on this website may not be representative of other clients or customers and is not a guarantee of future performance or success.