Data &
Technology
Research
Reports
Report Solutions
Reports Library
Actionable
Strategies
Free
Resources
Simple Backtest Calculator
Simple Seasonality Calculator
The Kelly Criterion Calculator
Sentiment Geo Map
Public Research Reports
Free Webinar
Pricing
Company
About
Meet Our Team
In the News
Testimonials
Client Success Stories
Contact
Log inLoginSign up
< BACK TO ALL REPORTS

This indicator shows the most speculation since 2000

Jason Goepfert
2021-03-11
Trading in penny stocks in February jumped to the highest levels since the first few months of the year 2000.

Over the past couple of months, we've been raising the alarm on several pockets of speculative activity, which had reached or exceeded all prior records.

Bullish options trading, IPO and add-on volume, and penny stock trading were among the most egregious examples. With the latter, it's only getting more extreme.

The latest figures are out, covering activity through the end of February, and it shows an increasing willingness to trade the riskiest securities available to individual investors.

The number of shares traded has jumped to nearly 2 trillion shares (yes, trillion).

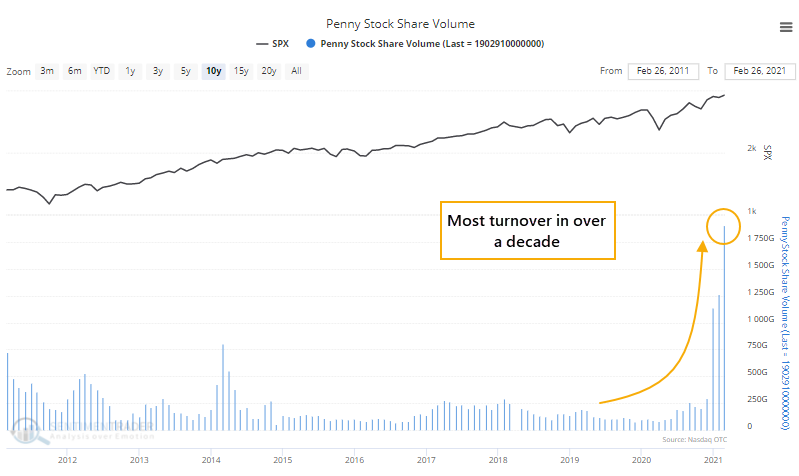
Zooming out further, we can see that only a few months in early 2006 exceeded this pace of activity.

The dollar volume traded rose to nearly $84 billion, again the highest in the past decade. Going back nearly 30 years, February's activity was only exceeded by January - March of 2000.

What else we're looking at

  • A closer - and further out - look at penny stock transactions in February
  • Initiating a deep dive into inflation, how it's measured, and what it's meant
  • The S&P 500 showed a highly unusual break internally on Tuesday
  • What happens when the Dow hits a high and the Nasdaq is well below its own

Stat Box

On Wednesday, the Dow Industrials closed at a new high, while the Nasdaq Composite closed more than 7% below its own high. Dating back to 1971, this has happened 10 other distinct times. Going forward, the Nasdaq tended to underperform the Dow across multiple time frames.


Etcetera

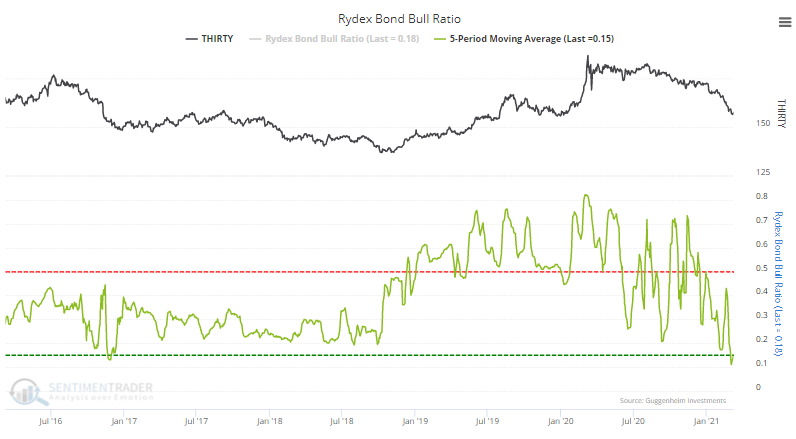
Mutual fund timers don't like bonds. The assets in bullish bond funds at the Rydex fund company are the lowest relative to bearish bonds funds in more than five years.

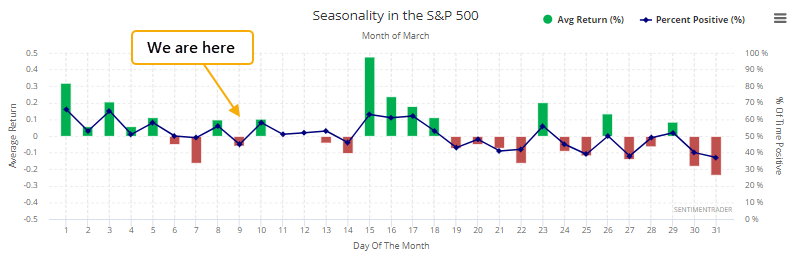
Stocks have a bit more tailwind. Judging by the calendar, stocks have a little over a week with a seasonal tailwind, before it turns into a headwind during the last two weeks.

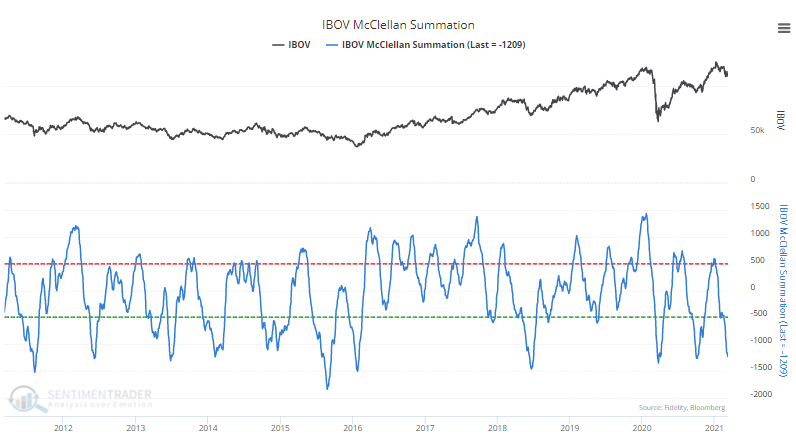
Brazilian stocks getting waxed. Internal selling pressure among stocks on Brazil's Ibovespa exchange has been so heavy and prolonged that the McClellan Summation Index just crossed below -1200, among the lowest readings in nearly 20 years.

DATA &
TECHnologies
IndicatorEdge
‍
BackTestEdge
‍
Other Tools
‍
DataEdge API
RESEARCH
reports
Research Solution
‍
Reports Library
‍
actionable
Strategies
Trading Strategies
‍
Smart Stock Scanner
‍
FREE
RESOUrCES
Simple Backtest
Calculator
Simple Seasonality
Calculator
The Kelly Criterion
Calculator
Sentiment Geo Map
‍
Public Research Reports
‍
Free Webinar
COMPANY
‍
About
‍
Meet our Team
‍
In the News
‍
Testimonials
‍
Client Success Stories
Pricing
Bundle pricing
‍
Announcements
‍
FAQ
© 2024 Sundial Capital Research Inc. All rights reserved.
Setsail Marketing
TermsPrivacyAffiliate Program
Risk Disclosure: Futures and forex trading contains substantial risk and is not for every investor. An investor could potentially lose all or more than the initial investment. Risk capital is money that can be lost without jeopardizing ones’ financial security or life style. Only risk capital should be used for trading and only those with sufficient risk capital should consider trading. Past performance is not necessarily indicative of future results.

Hypothetical Performance Disclosure: Hypothetical performance results have many inherent limitations, some of which are described below. No representation is being made that any account will or is likely to achieve profits or losses similar to those shown; in fact, there are frequently sharp differences between hypothetical performance results and the actual results subsequently achieved by any particular trading program. One of the limitations of hypothetical performance results is that they are generally prepared with the benefit of hindsight. In addition, hypothetical trading does not involve financial risk, and no hypothetical trading record can completely account for the impact of financial risk of actual trading. for example, the ability to withstand losses or to adhere to a particular trading program in spite of trading losses are material points which can also adversely affect actual trading results. There are numerous other factors related to the markets in general or to the implementation of any specific trading program which cannot be fully accounted for in the preparation of hypothetical performance results and all which can adversely affect trading results.

Testimonial Disclosure: Testimonials appearing on this website may not be representative of other clients or customers and is not a guarantee of future performance or success.