This indicator says the Nasdaq is split

From Jay...
Let's try to spell this out as succinctly as possible. In general terms:
- A lot of stocks making new highs and few making new lows = Bullish
- A lot of stocks making new lows and few making new highs = Bullish
- A lot of stocks making new highs and a lot of stocks making new lows = Bearish
A lot of stocks making new highs and few making new lows typically occurs during the heart of a bull market. Essentially, it is almost the definition of a bull market. A lot of stocks making new lows and few making new highs typically occurs near the end of a bear market, when "all appears lost."
On the other hand - a situation where a lot of stocks are making new highs at the same time a lot of other stocks are making new lows is commonly referred to as "churning." While the indexes may continue to move sideways to slightly higher, under the hood things are deteriorating.
We can quantify this using the HiLo Logic Index.
The original index was developed by Norman Fosback and was based on the NYSE. I have tended to focus more on the same indicator using the Nasdaq market.
The index is calculated as follows:
A = Daily Nasdaq new highs
B = Daily Nasdaq new lows
C = Total Nasdaq Issues traded
D = Lower of A and B
Nasdaq HiLo Logic Index = (D / C) *100
We can see that chart below, which we update daily. It just spiked above 4%, meaning that at least 4% of securities on the Nasdaq exchange hit either a 52-week high or a 52-week low on the same day. The red dots highlight those times when the Nasdaq HLLI registered a 1-day reading in excess of 4%.
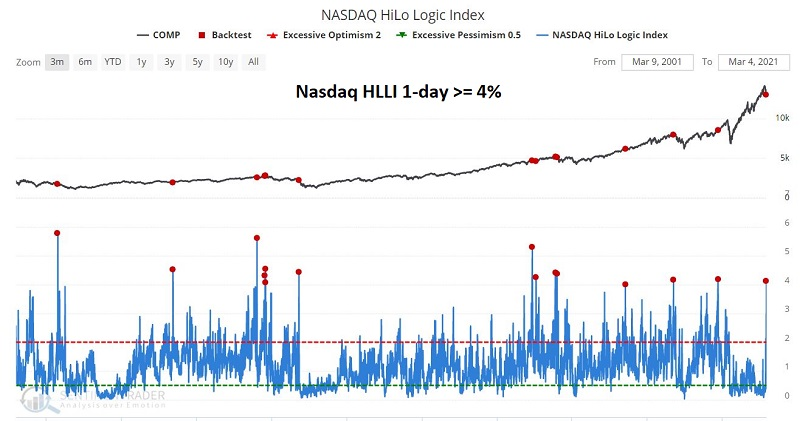
According to our Backtest Engine, over the past 20 years, a single-day reading above 4% preceded a positive return in the Nasdaq Composite index only 21% of the time.
What else we're looking at
- What happens in the Nasdaq when the HiLo Logic Index spikes, including over a multi-week period
- Why the shift from technology to financial stocks may just be getting started
- A look at what happens when S&P 500 momentum starts to shift
- The correlation between tech and rates is the highest in years - potential ramifications for medium-term Treasuries

| Stat Box The S&P 500, the most benchmarked equity index in the world, crossed below its 50-day moving average for the 1st time in almost 4 months on Thursday, after having recently been at an all-time high. Similar patterns preceded a positive return in the index over the next 2 months 16 out of 19 times, with only 1 loss larger than -2%. |
Sentiment from other perspectives
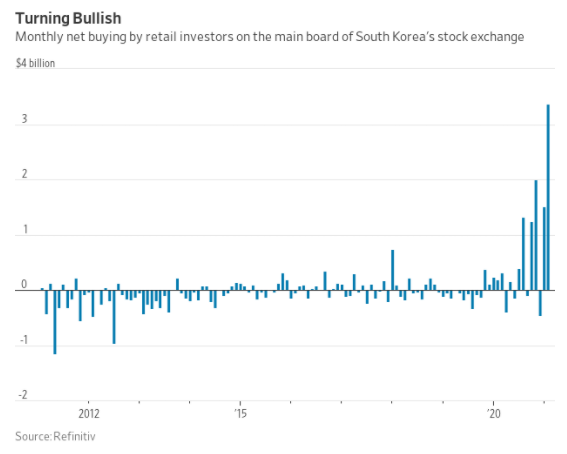
Retail frenzy. Continuing the theme of recent days showing massive investor appetite for risky assets across the globe, trading activity in Korea among retail traders has exploded to a degree not seen in years (if ever). Source: Wall Street Journal
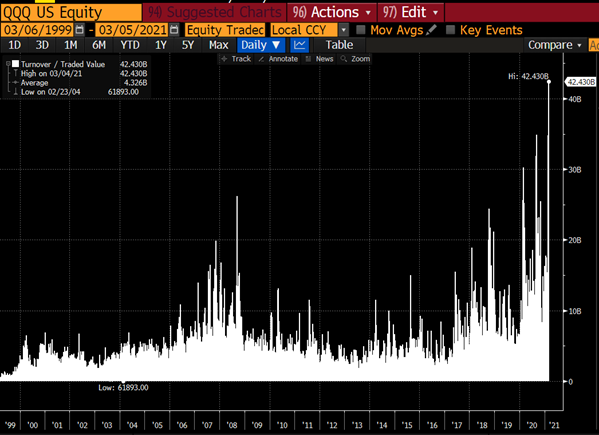
Panic, already? Volume tends to skyrocket during times of panic, and an argument could be made that there is a sense of that in the Nasdaq 100. The QQQ fund on Thursday traded the most value in its history. Source: Dani Burger
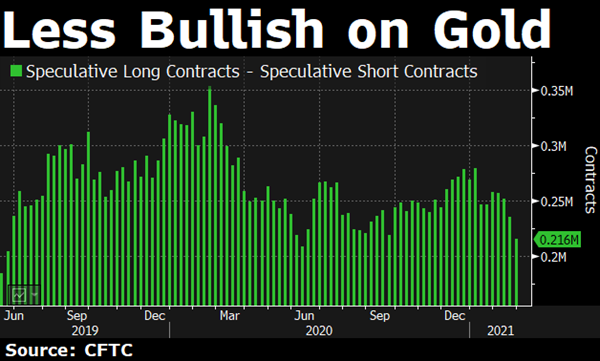
Less shiny. Speculators' net bets on gold have already drifte down to one of the lowest levels in almost 2 years. Source: Bloomberg TV