
These sectors have consistently outperformed the S&P 500 after major lows

Key points:
- After corrections or bear markets, cyclical sectors have shown the strongest tendency to outperform
- Six months after a correction, technology displayed the most favorable returns and consistency
- A sector-wide allocation to defensive groups like staples, health care, and utilities should be avoided
"Skate to where the puck is going to be, not where it has been." - Wayne Gretzky
It remains unclear whether the stock market has found its bottom in what may ultimately be remembered as a significant correction or if further downside price action will push the S&P 500 into an official bear market territory. Although we have shared evidence in several research reports that supports the latter scenario, it is critical to remain open-minded and flexible.
Market dynamics, such as Trump's tariff policy, can shift rapidly, and anchoring too rigidly to one outcome can cloud judgment. Regardless of the depth or classification of the drawdown, historical evidence is unambiguous: opportunities consistently emerge in specific sectors after significant corrections or bear market bottoms.
The table below shows sector performance compared to the S&P 500 in the six months following significant market lows. Historically, technology, consumer discretionary, financials, and industrials have been the most consistent outperformers, with Technology exceeding S&P 500 returns in 90% of all post-correction scenarios. Furthermore, technology has surpassed the broad market in each of the last 15 such occurrences since 1989, irrespective of the type of drawdown.
In contrast, traditionally defensive areas such as consumer staples, healthcare, and utilities have tended to underperform. Utilities have done so in 85% of post-correction cases, and consumer staples haven't outperformed in any of the 12 instances since 1997 following a correction or bear market low.
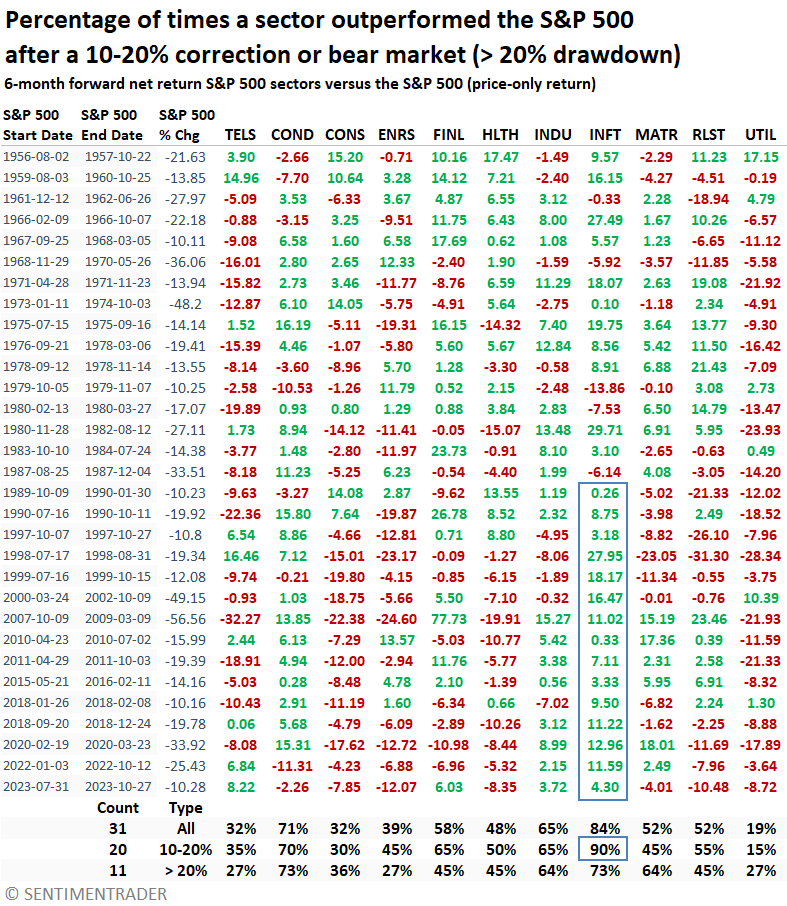
Note: Communications Services (TELS in the table) was restructured in 2018, now including growth-oriented names such as Google, Netflix, and Meta. Today, it should be viewed as an offensive sector, a shift from its pre-2018 defensive profile.
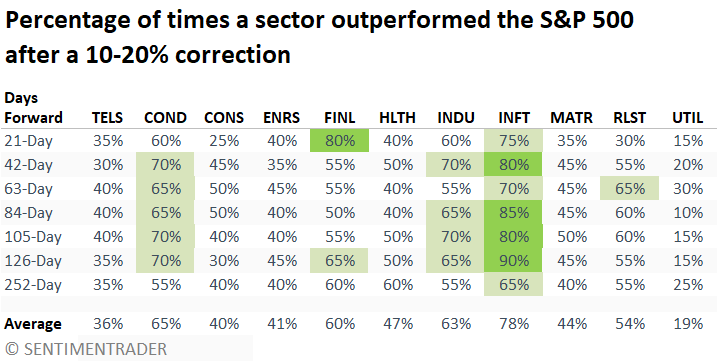
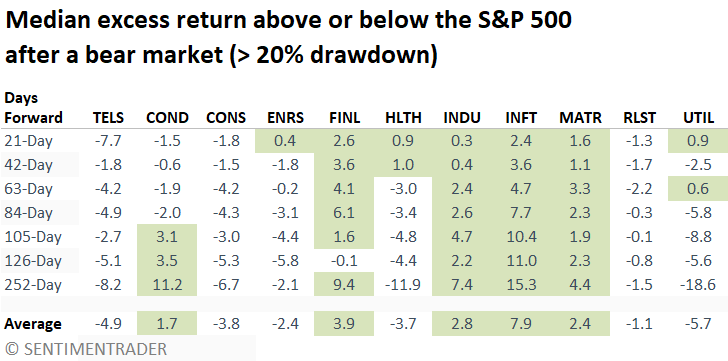
A summary of correction outcomes over various horizons
Whether looking one month ahead or a full year out, technology provided the most consistent relative leadership, followed by the consumer discretionary, industrial, and financial sectors.
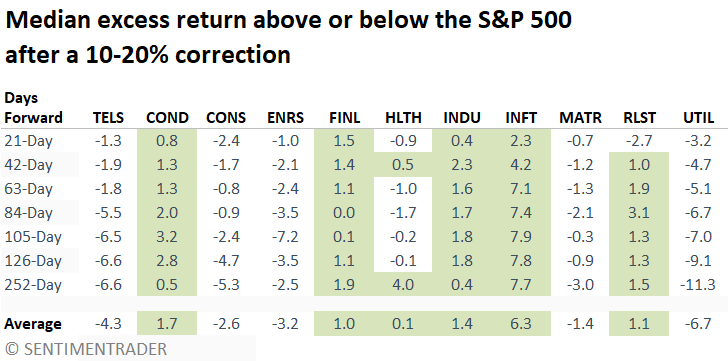
Across all measured periods, the consumer discretionary, financials, industrials, and technology sectors posted median returns above those of the S&P 500, with technology consistently delivering the highest excess return.
Although defensive groups underperformed, the real estate sector, a yield-oriented sector, displayed returns above the benchmark in almost all horizons.
A summary of bear market outcomes over various horizons
Post-bear market recoveries saw technology follow a similar outlook after corrections, although consistency was not as robust. On the other hand, Financials gained significant traction, with several horizons achieving a win rate of 80% or higher.
The consumer discretionary sector got off to a slow start, likely weighed down by recessionary overhangs, but eventually turned the corner, outperforming in 91% of instances over the following year. Materials, somewhat under the radar, also posted impressively consistent gains.
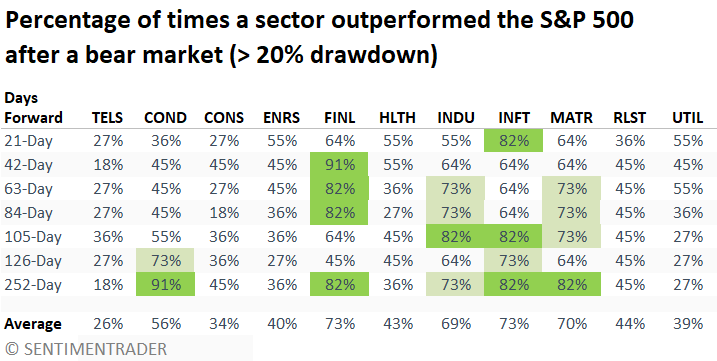
Once again, cyclically sensitive sectors exhibited the highest excess returns over the S&P 500, with technology leading the way.
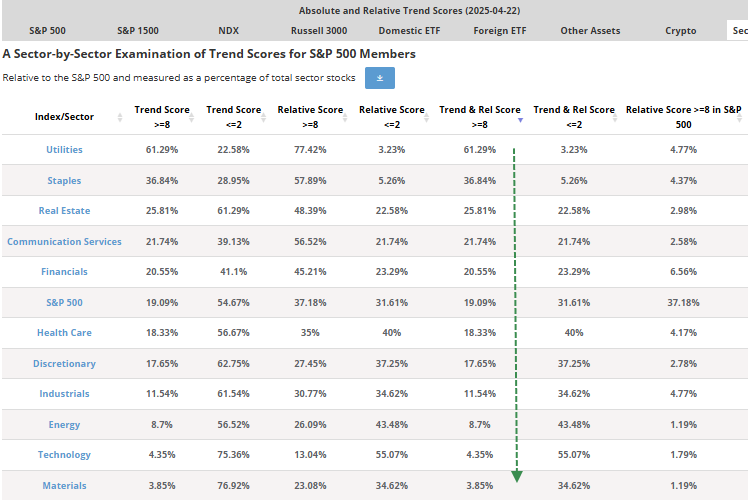
Fishing in the pond with the most opportunity
As the data stands now, defensive sectors lead with the highest proportion of stocks achieving trend and relative trend scores of eight or above, a condition often seen during pronounced market declines. However, to position ourselves for what lies ahead, closely monitoring this table on the trend score page will be vital if equity indexes begin forming a sustainable bottom that transitions into a new uptrend.
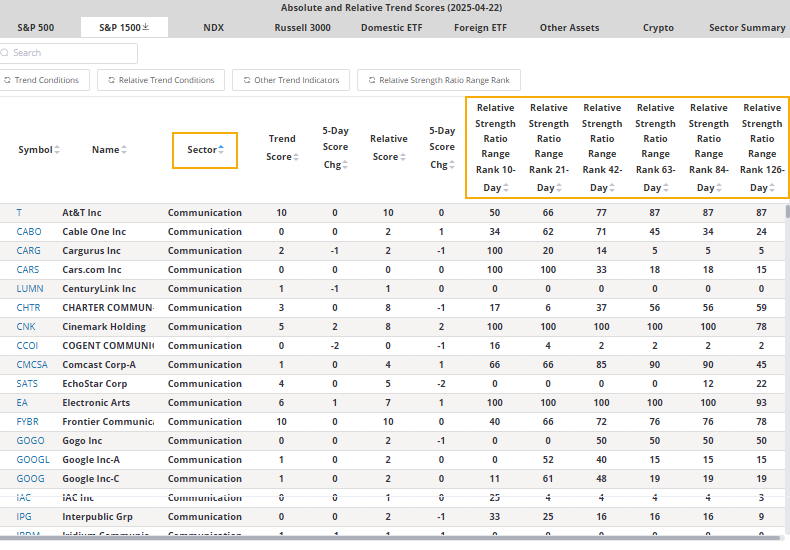
Users can sort trend score data on our website to uncover stocks within cyclical sectors that show favorable trends. A newly added indicator enhances idea generation by ranking the relative ratio of a stock to the S&P 500 over a specified lookback period. A score of 100 indicates a new relative high, whereas zero signals a new relative low.
When equity indexes are in the initial stages of forming a bottom after a significant correction, I look for cyclical sector stocks with high trend scores that are also breaking out on a relative basis.
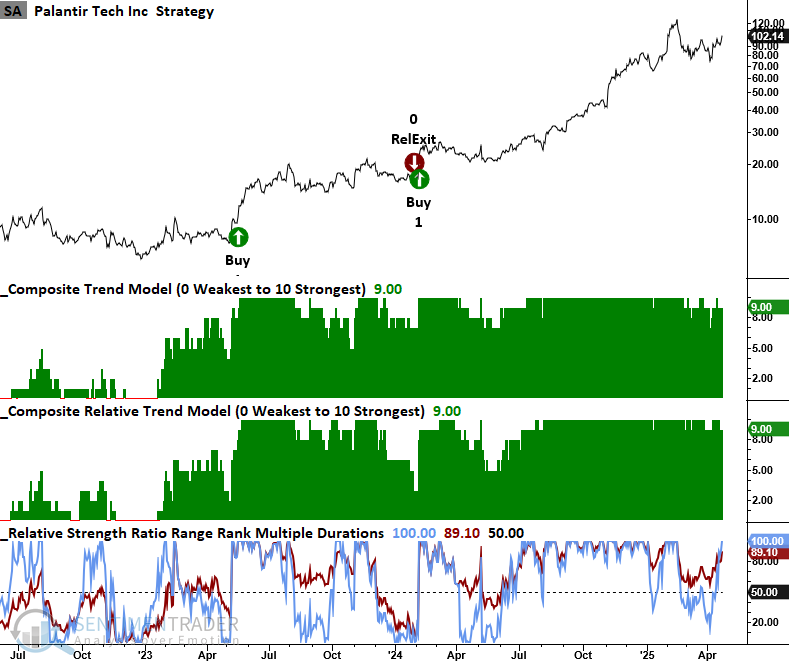
Let's take a look at a few examples in the charts below.
Palantir Technologies (PLTR) continues to exhibit leadership characteristics, sustaining a trend and relative trend score of 9. With today's move, PLTR has reached a 42-day relative high. Furthermore, its 6-month relative range rank currently resides at 89%, and throughout the market's recent drawdown, that rank consistently remained above 50%, a classic sign of leadership.
Spotify Technology continues to maintain excellent trend scores and register 6-month relative highs.

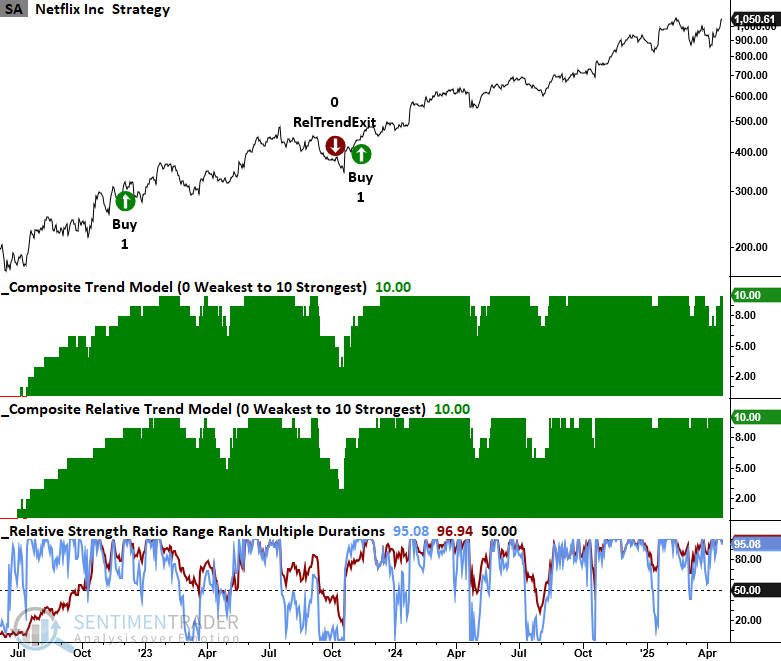
Netflix is on the cusp of breaking out to a new high, with both trend scores recording a perfect ranking of 10. Moreover, it has registered a six-month high in six out of the last 10 sessions, tied for the third most among S&P 500 companies, trailing only Copart (CPRT) and Amphenol (APH).
What the research tells us...
Cyclical sectors tend to outperform following significant market lows, benefiting from the rebound in economic activity and investor sentiment. Among these, the Technology sector has consistently delivered the strongest and most consistent relative performance, making the group a critical area to monitor in the early stages of market recoveries. Subscribers can monitor trend scores for cyclical sectors on our website to generate timely investment ideas and stay ahead of shifts in sector leadership. Three stocks exhibiting outstanding setups are Palantir, Spotify, and Netflix.