Data &
Technology
Research
Reports
Report Solutions
Reports Library
Actionable
Strategies
Free
Resources
Simple Backtest Calculator
Simple Seasonality Calculator
The Kelly Criterion Calculator
Sentiment Geo Map
Public Research Reports
Free Webinar
Pricing
Company
About
Meet Our Team
In the News
Testimonials
Client Success Stories
Contact
Log inLoginSign up
< BACK TO ALL REPORTS

These Bonds Just Triggered a Buy Signal

Jason Goepfert
2021-07-12
With an improving number of advancing bonds, an investment-grade bond timing model gave a thrust buy signal last week.

Bonds look like a buy again. Some of them, anyway.

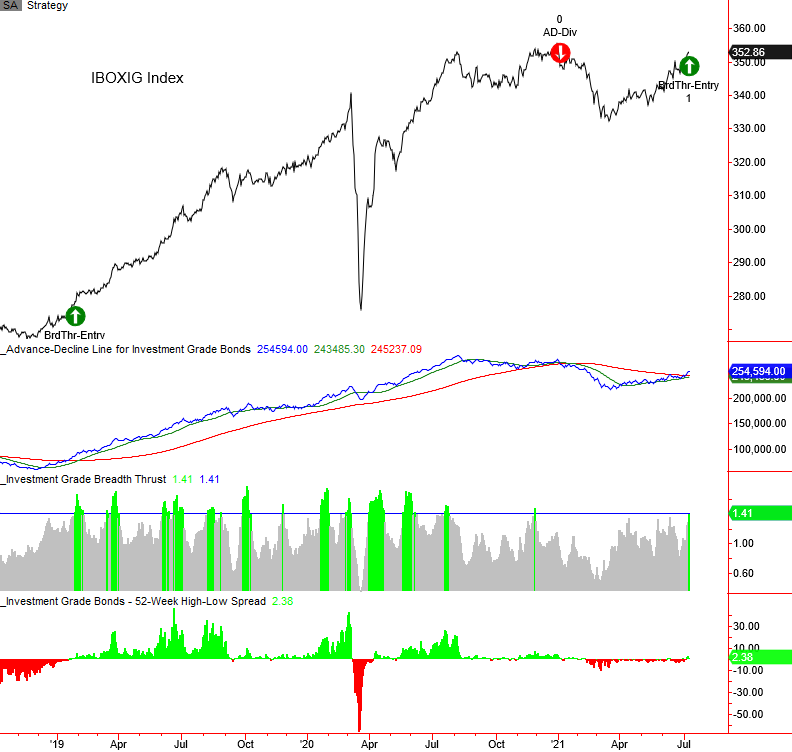
Investment-grade bonds registered a new breadth thrust buy signal late last week. The new signal now flips Dean's investment-grade timing model to the long side after having been on the sidelines since January.

In a nutshell, the model uses bond market breadth data to identify trend changes in advance of price action alone. If there is a sudden thrust of advancing bonds relative to declining bonds following a lull, then it will trigger a signal. Walter Deemer, a respected market strategist, calls this "breakaway momentum."

The investment-grade bond timing model is more sensitive to movements in Treasury yields, whereas high-yield bonds will be more sensitive to economic/credit conditions. The recent decline in Treasury yields is playing a role in the new signal. We can see the last few years of history below.

investment grade bond timing model

While we should respect the message this can provide as it relates to the economy, credit conditions, and the stock market, we have to keep in mind that the data history is limited and the sample size is small.


What else we're looking at

  • Stats showing the success or all prior investment-grade bond market timing signals
  • What thrusts have meant for bonds and stocks
  • The U.S. dollar is at a price and seasonality crossroads
  • What the trend in leading economic indicators means for the Real Estate sector

Stat box

Some Asian stocks have been getting hit hard, enough to push nearly 60% of stocks in the Kospi Index to 4-week lows. That's the most since March 2020.

Etcetera

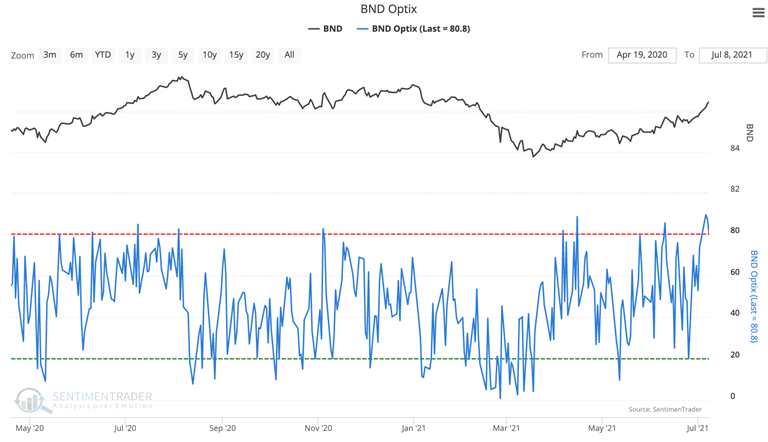
Billowing bonds. This week the BND Optix hit a yearly high, reaching 89 on Tuesday. Past returns were lackluster when the Optix crossed above 80.

bnd bond market optimism

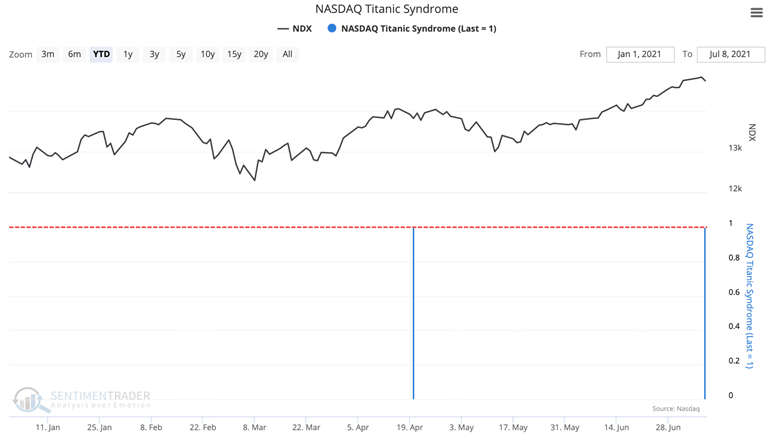
Sinking ship? A Titanic Syndrome just triggered on the Nasdaq exchange for the second time in 2021. This technical warning sign was created by Bill Omaha in the 1960s. It highlights a condition when stocks have recently been at a high, and then there is a sudden jump in new 52-week lows versus highs.

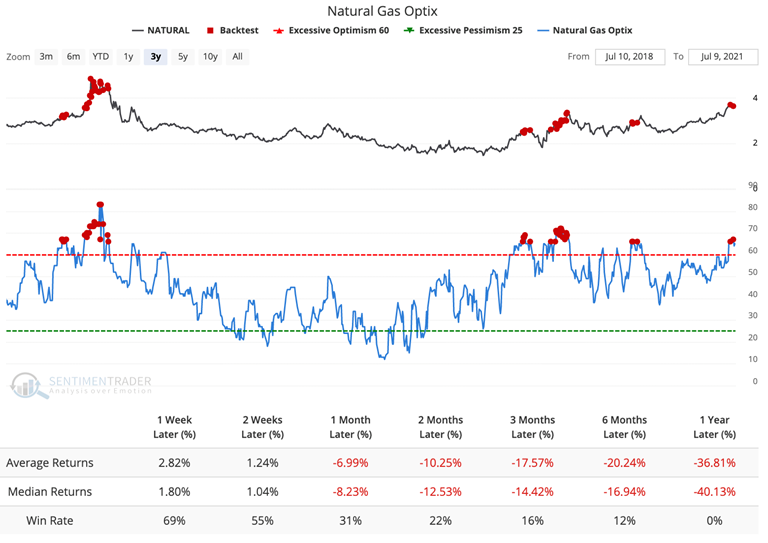
Excuse you. Natural Gas optimism recently reached its highest point in 2021. According to our Backtest Engine, in the past three years when Optix is above 65, natural gas futures prices have consistently declined.

natural gas sentiment

Our Backtest Engine allows users to test virtually every indicator our service offers in seconds. You can change indexes, parameters, trends, and lookback periods and see how it impacts future returns. We're working hard on version 2.0 which will allow even more flexibility.
DATA &
TECHnologies
IndicatorEdge
‍
BackTestEdge
‍
Other Tools
‍
DataEdge API
RESEARCH
reports
Research Solution
‍
Reports Library
‍
actionable
Strategies
Trading Strategies
‍
Smart Stock Scanner
‍
FREE
RESOUrCES
Simple Backtest
Calculator
Simple Seasonality
Calculator
The Kelly Criterion
Calculator
Sentiment Geo Map
‍
Public Research Reports
‍
Free Webinar
COMPANY
‍
About
‍
Meet our Team
‍
In the News
‍
Testimonials
‍
Client Success Stories
Pricing
Bundle pricing
‍
Announcements
‍
FAQ
© 2024 Sundial Capital Research Inc. All rights reserved.
Setsail Marketing
TermsPrivacyAffiliate Program
Risk Disclosure: Futures and forex trading contains substantial risk and is not for every investor. An investor could potentially lose all or more than the initial investment. Risk capital is money that can be lost without jeopardizing ones’ financial security or life style. Only risk capital should be used for trading and only those with sufficient risk capital should consider trading. Past performance is not necessarily indicative of future results.

Hypothetical Performance Disclosure: Hypothetical performance results have many inherent limitations, some of which are described below. No representation is being made that any account will or is likely to achieve profits or losses similar to those shown; in fact, there are frequently sharp differences between hypothetical performance results and the actual results subsequently achieved by any particular trading program. One of the limitations of hypothetical performance results is that they are generally prepared with the benefit of hindsight. In addition, hypothetical trading does not involve financial risk, and no hypothetical trading record can completely account for the impact of financial risk of actual trading. for example, the ability to withstand losses or to adhere to a particular trading program in spite of trading losses are material points which can also adversely affect actual trading results. There are numerous other factors related to the markets in general or to the implementation of any specific trading program which cannot be fully accounted for in the preparation of hypothetical performance results and all which can adversely affect trading results.

Testimonial Disclosure: Testimonials appearing on this website may not be representative of other clients or customers and is not a guarantee of future performance or success.