Data &
Technology
Research
Reports
Report Solutions
Reports Library
Actionable
Strategies
Free
Resources
Simple Backtest Calculator
Simple Seasonality Calculator
The Kelly Criterion Calculator
Sentiment Geo Map
Public Research Reports
Free Webinar
Pricing
Company
About
Meet Our Team
In the News
Testimonials
Client Success Stories
Contact
Log inLoginSign up
< BACK TO ALL REPORTS

These 2 sectors soar when sentiment plunges

Jason Goepfert
2021-11-18
Consumer sentiment has plunged to the lowest since 2012. Retail sales gave those stocks a boost. Mid-Cap stocks are entering a power period.

Consumers give up the ghost

The latest survey results from the University of Michigan shocked economists.

For the first time since 2012, the overall level of consumer confidence was below 70, well below even the most negative economist on Wall Street. If it holds up, it would be the worst miss versus expectations in 22 years.

This ended the 2nd-longest stretch of readings above 70 since 1978.

Consumer sentiment is below 70 for the first time in years

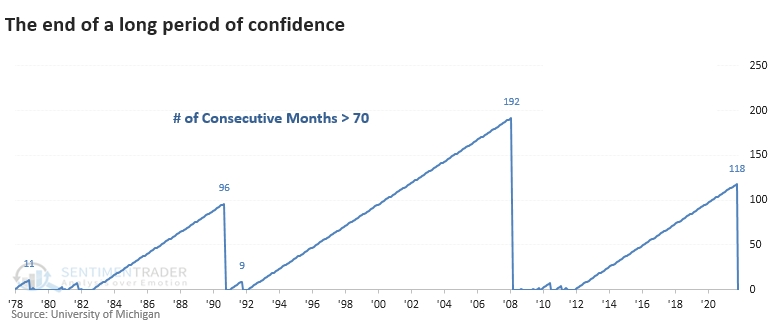
We all know the difficulty of relying on a sample size of 3, so the caveats are huge. The 1978 and 1990 drops in sentiment preceded gains of more than 35% in the S&P 500 over the next couple of years. The 2008 signal was near the beginning of the Global Financial Crisis (GFC) and major losses.

Among sectors and factors, there were two that stood out against all the others, Small-Cap and Value.

Stat box

Fewer than 5% of Energy sector stocks are trading above their 10-day moving averages. Of the 29 other days in the past year with so few short-term uptrends, XLE showed a positive return 2 weeks later after 25 of them, according to our Backtest Engine.


Retail responds well to Sales report

Dean noted that the equal-weighted retail ETF (XRT) was up 1.06% on Tuesday, which means participation was broad-based even though Amazon was down on the day. This was a day when the Retail Sales Report was released.

A similar signal has triggered 30 other times over the past 21 years. After the others, future returns and win rates were above historical averages across almost every time frame. 

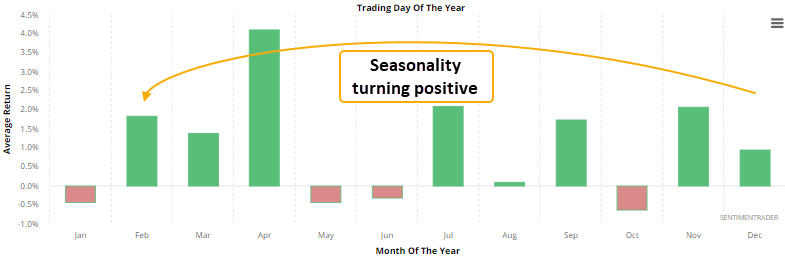
With retail seasonality about to turn positive, Dean also looked at the outlook for the Retail Sales study when the signal triggers in November or December.

Retail stocks are entering a positive time

This signal has occurred 7 other times over the past 24 years. 

A "power period" for Mid-Caps

Jay noted that the often-overlooked Mid-Cap group of stocks is about to enter a seasonal power period.

The chart below displays the cumulative growth of $1 invested in the S&P 400 Index (price-performance only) every year during these power periods since the index began in 1981.

Mid cap stocks are entering a power period

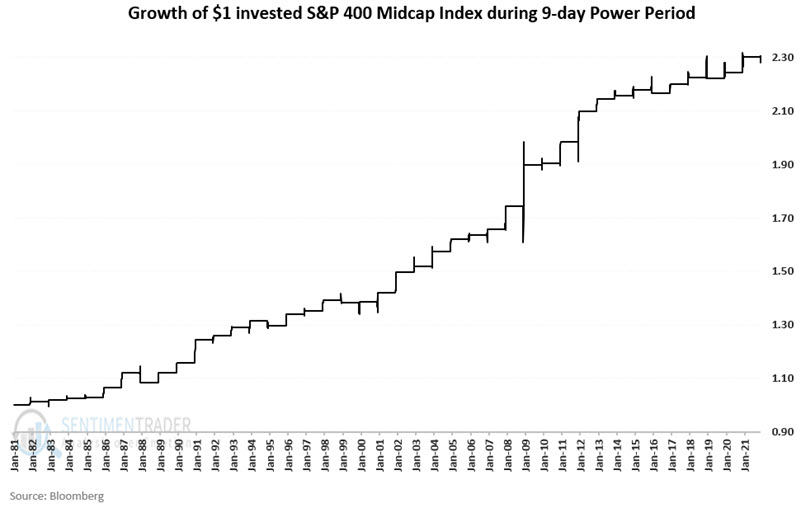
Traders can employ this strategy using ticker IJH (iShares Core S&P Mid-Cap ETF) or ticker MDY (SPDR S&P MIDCAP 400 ETF Trust) to track the S&P 400 Midcap Index.

DATA &
TECHnologies
IndicatorEdge
‍
BackTestEdge
‍
Other Tools
‍
DataEdge API
RESEARCH
reports
Research Solution
‍
Reports Library
‍
actionable
Strategies
Trading Strategies
‍
Smart Stock Scanner
‍
FREE
RESOUrCES
Simple Backtest
Calculator
Simple Seasonality
Calculator
The Kelly Criterion
Calculator
Sentiment Geo Map
‍
Public Research Reports
‍
Free Webinar
COMPANY
‍
About
‍
Meet our Team
‍
In the News
‍
Testimonials
‍
Client Success Stories
Pricing
Bundle pricing
‍
Announcements
‍
FAQ
© 2024 Sundial Capital Research Inc. All rights reserved.
Setsail Marketing
TermsPrivacyAffiliate Program
Risk Disclosure: Futures and forex trading contains substantial risk and is not for every investor. An investor could potentially lose all or more than the initial investment. Risk capital is money that can be lost without jeopardizing ones’ financial security or life style. Only risk capital should be used for trading and only those with sufficient risk capital should consider trading. Past performance is not necessarily indicative of future results.

Hypothetical Performance Disclosure: Hypothetical performance results have many inherent limitations, some of which are described below. No representation is being made that any account will or is likely to achieve profits or losses similar to those shown; in fact, there are frequently sharp differences between hypothetical performance results and the actual results subsequently achieved by any particular trading program. One of the limitations of hypothetical performance results is that they are generally prepared with the benefit of hindsight. In addition, hypothetical trading does not involve financial risk, and no hypothetical trading record can completely account for the impact of financial risk of actual trading. for example, the ability to withstand losses or to adhere to a particular trading program in spite of trading losses are material points which can also adversely affect actual trading results. There are numerous other factors related to the markets in general or to the implementation of any specific trading program which cannot be fully accounted for in the preparation of hypothetical performance results and all which can adversely affect trading results.

Testimonial Disclosure: Testimonials appearing on this website may not be representative of other clients or customers and is not a guarantee of future performance or success.