
The VIX Index in an election year

Key points
- The CBOE Volatility Index (VIX) has demonstrated a very persistent pattern during presidential election years
- One caveat is a small sample size since VIX data goes back to 1985, and election years occur only once every four years
- Still, the historical pattern from March through November has been remarkably consistent
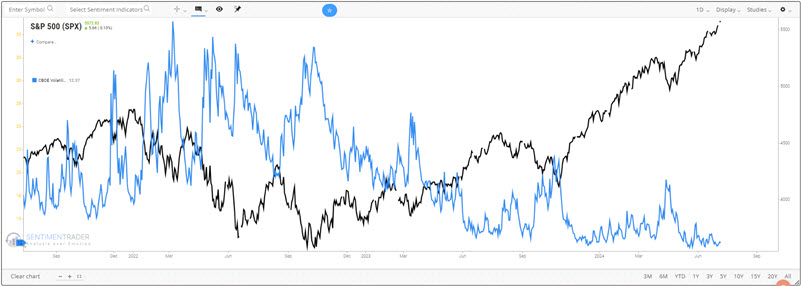
Historically, lower and/or declining values for the VIX have been associated with higher stock prices. Conversely, higher and/or rising values for the VIX have been associated with lower stock prices.
Suppose the history of VIX action during presidential election years holds this year (although it should be noted that there is absolutely no guarantee that it will). In that case, investors might expect higher prices through August, lower prices during September and October, and a rebound in November. Remember, that is not a prediction; it is simply an application of historical trends to the immediate future.
Let's take a closer look.
VIX during March through August of election years
For our testing, we will look at the raw point change in the VIX Index for each month - or period of months - under consideration. We will start by looking at March through August of election years. In other words, we will measure the net point change in the VIX index from the close on the last trading day of February through the close on the last trading day of August.
The chart below displays the cumulative results of this test.
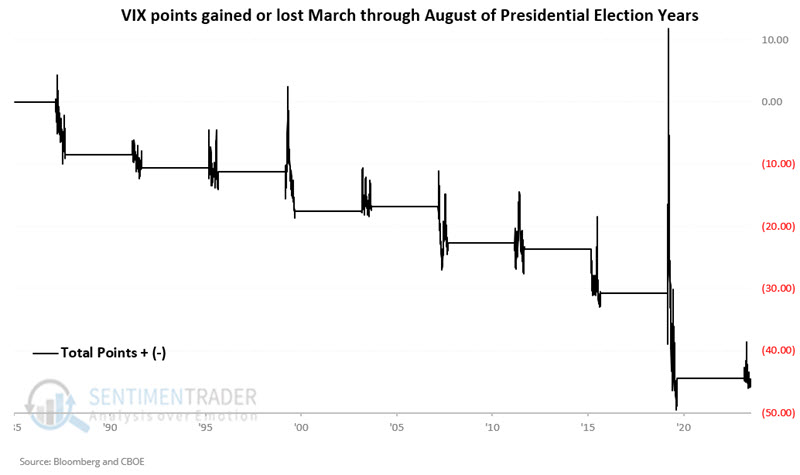
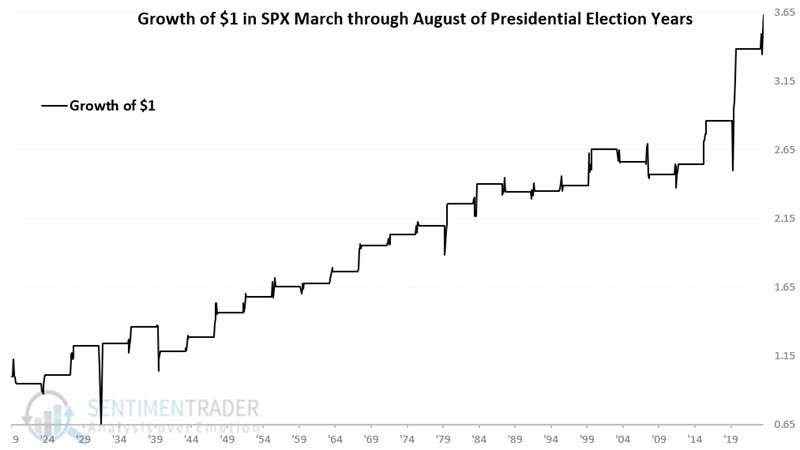
This period showed a slight increase of 0.77 points in 2004. Likewise, there was the COVID panic-induced spike in March 2020 (which quickly reversed sharply lower after the stock market bottomed). During all other presidential election years, the VIX declined from the end of February through the end of August. We would anticipate this to equate overall to positive stock market performance. The chart below displays the growth of $1 invested in the S&P 500 Index only during the months of March through August of election years since 1920.
VIX during September and October of election years
For this test, we will measure the net point change in the VIX index from the close on the last trading day of August through the close on the last trading day of October.
The chart below displays the cumulative results of this test.
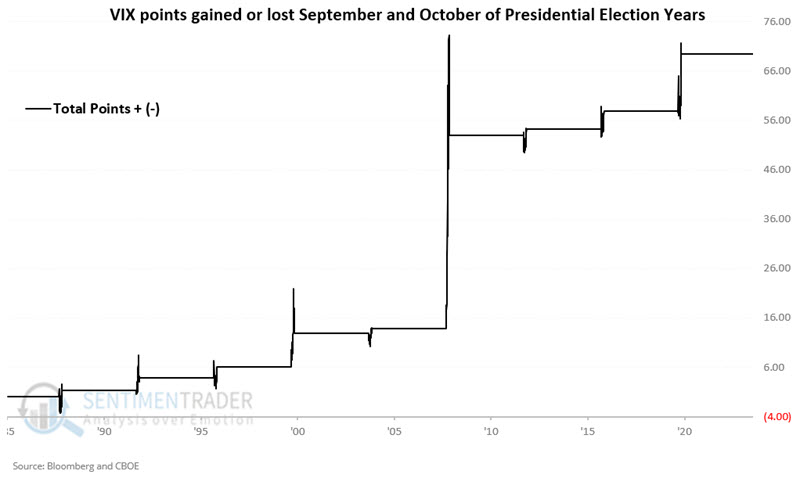
Starting in 1988, all nine "September/October of election year" periods have seen VIX increase.
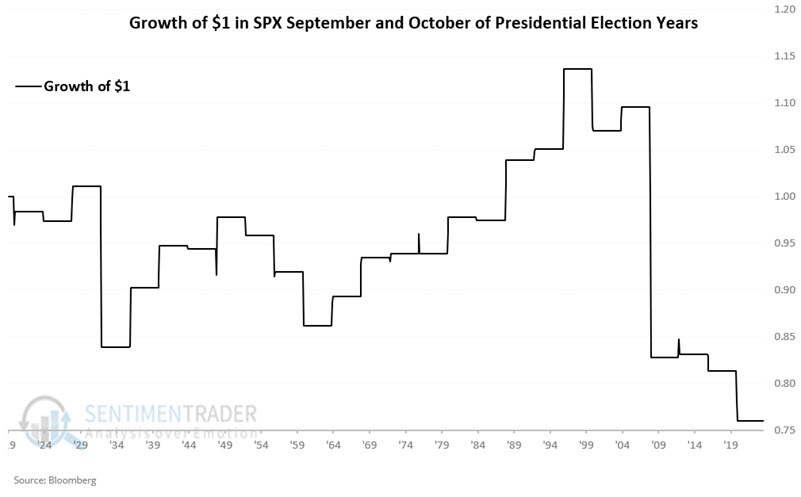
We would anticipate this to equate to subpar stock market performance overall. The chart below displays the growth of $1 invested in the S&P 500 Index only during the months of September and October of election years since 1920.
VIX during November of election years
For this test, we will measure the net point change in the VIX index from the close on the last trading day of October through the close on the last trading day of November.
The chart below displays the cumulative results of this test.
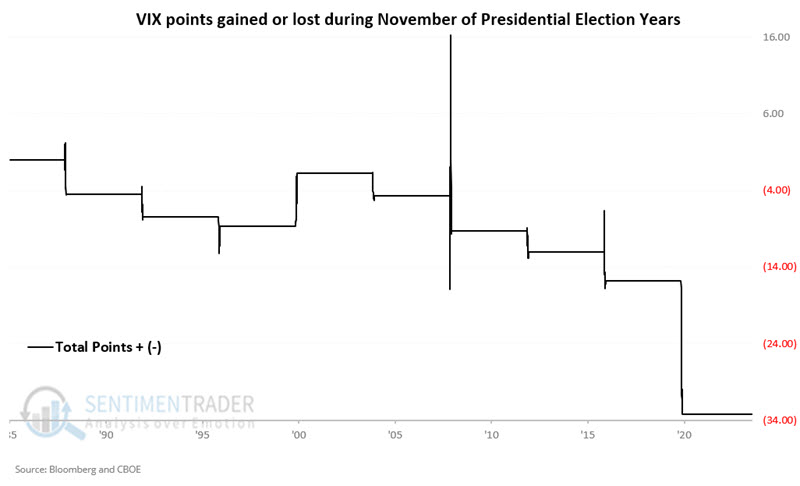
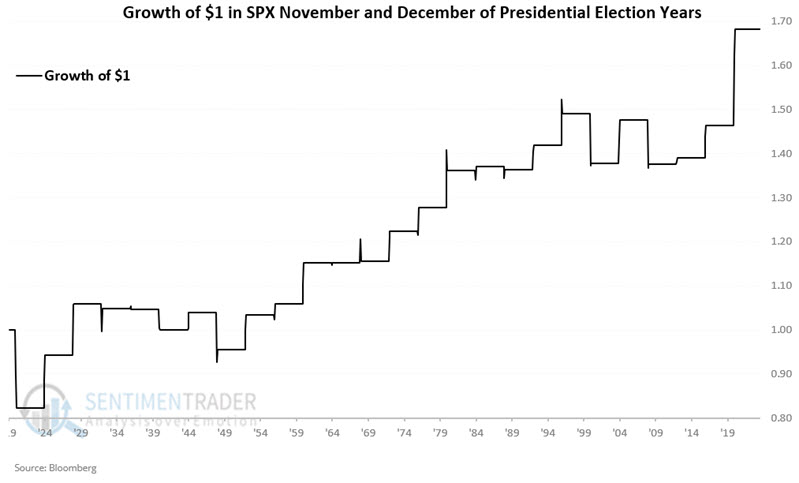
November 2000 saw the VIX Index gain +6.93 points, and there was a short-lived spike in November 2008. However, all other "November of election years" have seen the VIX Index decline in value. Historically, November of election years have been something of a "reversal" month for stocks. So we would anticipate this to equate overall to positive stock market performance for the November and December period of election years. The chart below displays the growth of $1 invested in the S&P 500 Index only during the months of November and December of election years since 1920.
Putting the results together
The table below displays the VIX Index performance on a period-by-period basis for each election year starting in 1988. The 2024 March through August value is updated through 2024-07-08.
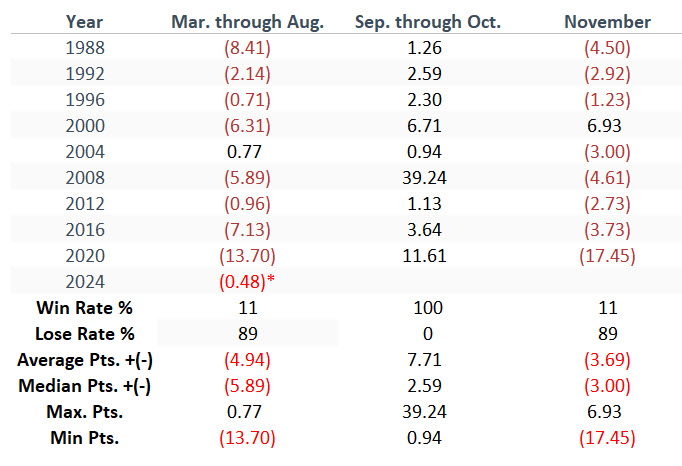
March through August and November have only seen one election year, which bucked the lower VIX trend. So far, every election year (since VIX was first calculated) has seen volatility rise by some degree during September and November.
What the research tells us…
The VIX Index has demonstrated a history of weakness from March through August and again in November. It also has shown a tendency to "spike" during October. So far in 2024, the March through August period has witnessed a decline of just a fraction of a point with a little over a month and a half to go, so it could still buck the "lower during March through August" trend. Will the VIX spike during September and October? There is no way to predict, and there is no guarantee. But given the history, it certainly makes sense to have a contingency plan if volatility does pick up significantly during that time. However, even if volatility does spike in the months ahead, investors should anticipate that any sharp rise in volatility will be short-lived and could be unwound during November.
There is no guarantee that the history of stock market performance shown above (higher March through August, and during November and December and lower during September and October) will continue this year. But it does appear to be a pattern worth watching.