Data &
Technology
Research
Reports
Report Solutions
Reports Library
Actionable
Strategies
Free
Resources
Simple Backtest Calculator
Simple Seasonality Calculator
The Kelly Criterion Calculator
Sentiment Geo Map
Public Research Reports
Free Webinar
Pricing
Company
About
Meet Our Team
In the News
Testimonials
Client Success Stories
Contact
Log inLoginSign up
< BACK TO ALL REPORTS

The top 5 stocks are driving this rally, and that's not good

Jason Goepfert
2020-05-13
The top 5 stocks in the S&P 500 are driving this rally. This handful of companies has accounted for nearly 25% of the S&P's total point gain since the March 23 low, among the highest percentages of any rally since 1990. Rallies that are driven by so few stocks have had a much harder time adding to gains.

The big winners just keep on winning, and it's starting to unnerve a lot of investors. It turns out they have a good reason for concern.

Most of us have seen some version of a chart like this from Goldman Sachs floating around:

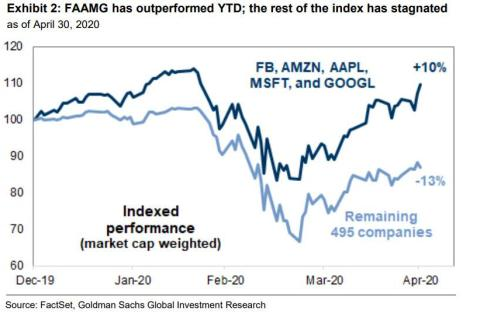
Some combination of FAANG or FAAMG (Facebook, Amazon, Apple, Netflix - or Microsoft - and Google) has been handily beating most other stocks. And that matters, because those stocks are huge, and they're driving a big portion of the gains.

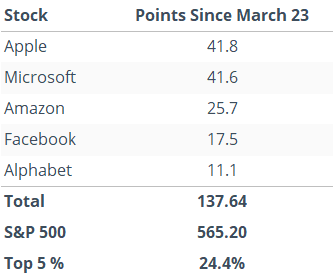
In the 35 days since the March 23 bottom, the top 5 drivers within the S&P 500 have accounted for 138 points out of the total 565 that the S&P has gained. So, only 5 stocks have accounted for more than 24% of the total point gain.

But...so what? Does it matter? Don't the top stocks always drive the index? Our good friend Tony Dwyer, the excellent strategist at Canaccord Genuity, helped answer this question in recent days, and it's not pretty.

To check, we'll look for every time the S&P 500 set a 52-week low, then rallied for 35 sessions. Over those 35-day periods, we'll look at the total points gained in the top 5 stocks versus the total points gained in the entire S&P 500.

Below, we can see the rallies that saw the top 5 stocks account for less than 20% of the S&P 500's total point gain.

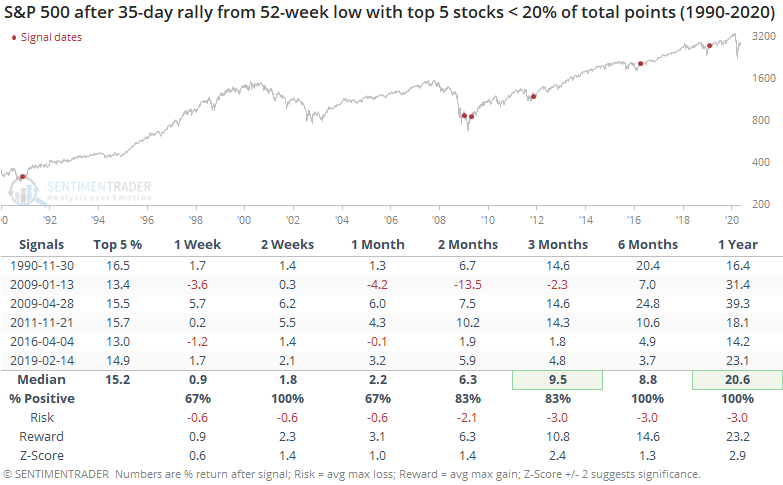
This was a good sign, with only one of them being a fakeout that ended up leading to a lower low. Each of the others proved to be sustainable, with excellent gains in the months ahead and a very positively skewed risk/reward ratio.

Now, let's check the 35-day rallies when the top 5 stocks accounted for more than 20% of the S&P's total gain. Bulls may want to avert their eyes.

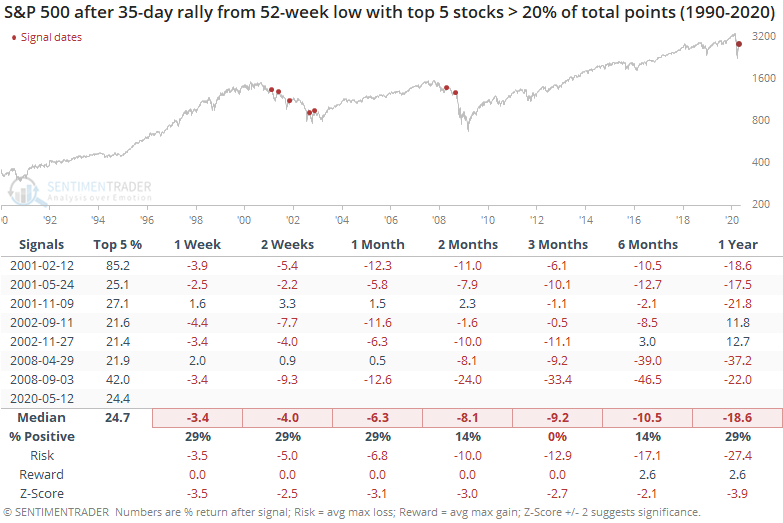
Every one of these proved to be a false rally, with the S&P losing ground over the next few months after each one. The risk/reward was horrid.

At 24.4%, the current weighting of the top 5 isn't as egregious as the worst time periods (like February 2001's weight of a whopping 85%) but it's definitely in the top tier.

There is no question we've seen unprecedented developments over the past two months. That makes any historical comparison questionable. From what we can see, though, when the initial rally off of a low is driven primarily by only a mere handful of stocks, it has been very difficult for the broader market to continue its gains.

Sorry, you don't have access to this report

Upgrade your subscription plan to get access
Go to Dasboard
DATA &
TECHnologies
IndicatorEdge
‍
BackTestEdge
‍
Other Tools
‍
DataEdge API
RESEARCH
reports
Research Solution
‍
Reports Library
‍
actionable
Strategies
Trading Strategies
‍
Smart Stock Scanner
‍
FREE
RESOUrCES
Simple Backtest
Calculator
Simple Seasonality
Calculator
The Kelly Criterion
Calculator
Sentiment Geo Map
‍
Public Research Reports
‍
Free Webinar
COMPANY
‍
About
‍
Meet our Team
‍
In the News
‍
Testimonials
‍
Client Success Stories
Pricing
Bundle pricing
‍
Announcements
‍
FAQ
© 2024 Sundial Capital Research Inc. All rights reserved.
Setsail Marketing
TermsPrivacyAffiliate Program
Risk Disclosure: Futures and forex trading contains substantial risk and is not for every investor. An investor could potentially lose all or more than the initial investment. Risk capital is money that can be lost without jeopardizing ones’ financial security or life style. Only risk capital should be used for trading and only those with sufficient risk capital should consider trading. Past performance is not necessarily indicative of future results.

Hypothetical Performance Disclosure: Hypothetical performance results have many inherent limitations, some of which are described below. No representation is being made that any account will or is likely to achieve profits or losses similar to those shown; in fact, there are frequently sharp differences between hypothetical performance results and the actual results subsequently achieved by any particular trading program. One of the limitations of hypothetical performance results is that they are generally prepared with the benefit of hindsight. In addition, hypothetical trading does not involve financial risk, and no hypothetical trading record can completely account for the impact of financial risk of actual trading. for example, the ability to withstand losses or to adhere to a particular trading program in spite of trading losses are material points which can also adversely affect actual trading results. There are numerous other factors related to the markets in general or to the implementation of any specific trading program which cannot be fully accounted for in the preparation of hypothetical performance results and all which can adversely affect trading results.

Testimonial Disclosure: Testimonials appearing on this website may not be representative of other clients or customers and is not a guarantee of future performance or success.