
The stock market as a leading economic indicator

Key points
- The stock market is a leading indicator of the economy and not the other way around
- We can use the performance of the S&P 500 Index over 12 months to assess the likelihood of economic decline in the subsequent month
- Self-described "numbers geeks" will enjoy digging into this piece; to all others, I apologize in advance for the potential headache
The stock market leads the economy, NOT the other way around
It is somewhat amazing how many articles and posts one can find online that goes something like this: "Economic indicator XYZ appears to be warning of an economic slowdown; therefore, we should expect the stock market to weaken." Sigh.
It is surprising how many people are unaware that one of the official "Leading Economic Indicators" is the S&P 500 Index itself. The bottom line: The stock market leads the economy, not vice versa.
The hypothesis here is that:
- Generally, the stock market performs better in the 12 months before a monthly economic gain and less well or even poorly in the 12 months before a monthly economic decline.
To test this hypothesis, we will use the following data to highlight the relationship between stocks and economic activity.
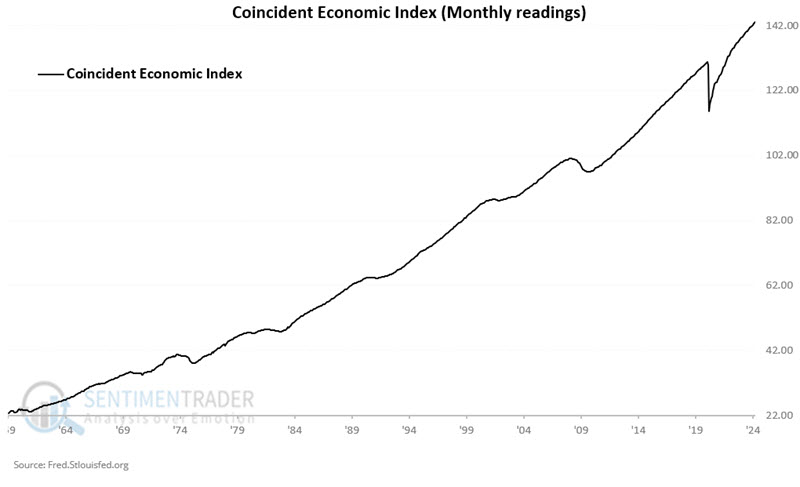
A = Monthly reading for the Coincident Economic Activity Index (CEI) for the U.S.
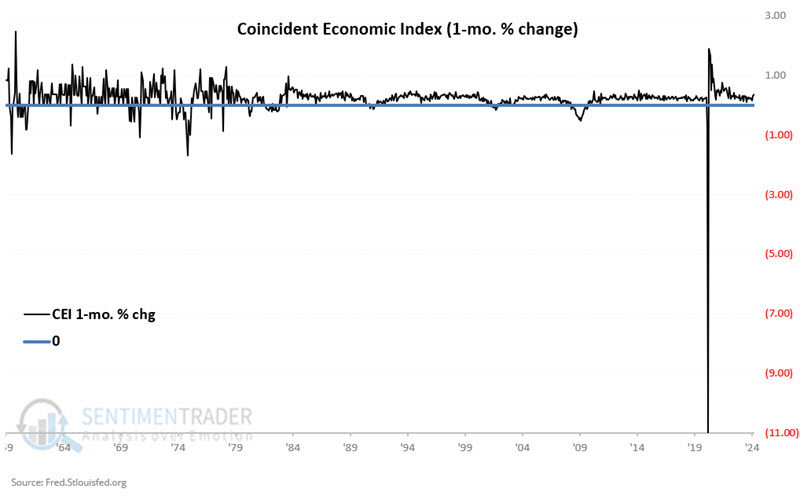
B = Percentage change in A for the latest month
C = 12-month % change for the S&P 500 at the end of the previous month
The chart below displays Variable A above, i.e., the Coincident Economic Activity Index
The chart below displays Variable B, i.e., the monthly percentage change in the Coincident Economic Index. Note the huge -11% month registered due to the forced economic shutdown due to Covid-19 in 2020.
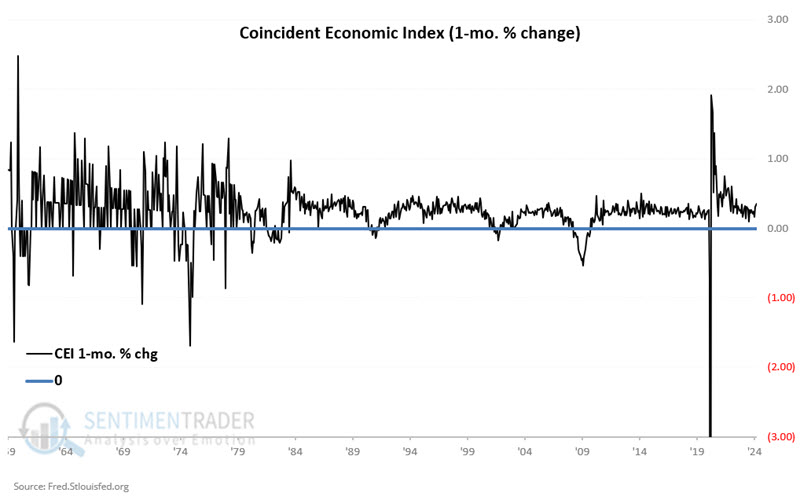
The chart below displays the monthly changes between +3% and -3% to help you get a better sense of monthly fluctuations.
Testing S&P 500 performance as a leading economic indicator
What we want to test is:
- How the S&P performed in the year before a month that showed economic growth (or flat economic growth)
- Versus how the S&P 500 performed in the year before a month that showed economic decline
Let's walk through one month's example to highlight what is being measured. The Coincident Economic Index is reported with a one-month lag. For example:
- On 2024-05-24, the CEI value for April 2024 was reported as 143.15
- The reading for the previous month was 142.90
Therefore:
A = 143.15
B = ((143.15 / 142.90) - 1) * 100 = 0.17 (percentage change for the latest month)
In other words, April 2024 saw an increase in economic activity. So, the next question is, "How did the S&P 500 perform in the 12 months before that monthly increase in monthly economic activity?"
To answer that, we divide the closing price for the S&P 500 at the end of March 2024 by the closing price for the S&P 500 at the end of March 2023. The S&P closed March 2024 at 5234.18 and March 2023 at 4109.31, for a 12-month gain of 27.4%.
In other words, in this one instance, the positive 12-month performance of the S&P 500 Index correctly presaged a monthly gain in economic activity.
Now let's look at all the months since March 1959.
A broader test
Since 1959, the Coincident Economic Index has shown a monthly gain 698 times and a monthly decline 85 times. In other words, the index has shown a monthly gain 89% of the time and a monthly decline only 11% of the time.
The table below compares the performance of the S&P 500 Index in the 12 months before months that showed an economic gain versus its performance in the 12 months before months that showed an economic decline.
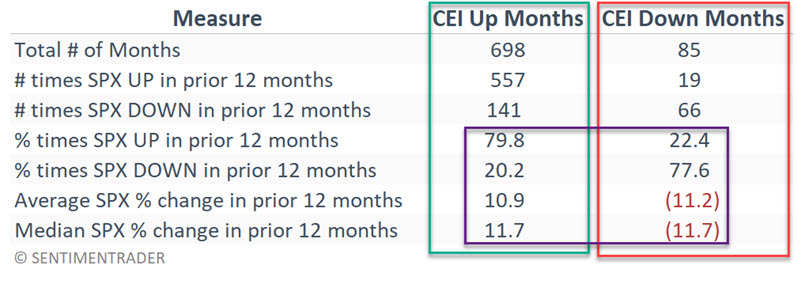
Note the stark differences. Months that showed a gain in the Coincident Economic Index saw the S&P 500 show a gain in the previous 12 months, almost 80% (79.8% to be exact) of the time, with a median 12-month gain of +11.7%.
Conversely, months that show a decline in the Coincident Economic Index saw the S&P 500 show a gain in the previous 12 months only 22.4% of the time, with a median 12-month decline of -11.7%.
What a declining 12 months for SPX really means
Here is where it turns into more of a mind-bender. Consider the following statement:
- A majority of months (77.6% to be exact) that showed economic contraction have been preceded by a 12-month decline in the S&P 500 Index. However, a 12-month decline in the S&P 500 Index is not always followed by an economic contraction.
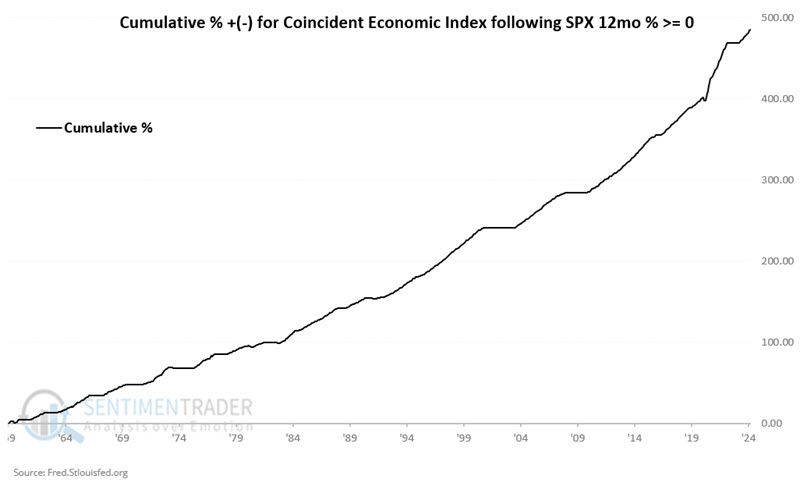
Let's take a more visual approach to understanding the statement above. The chart below displays the cumulative % gain for the Coincident Economic Index if we only count months following a 12-month gain for the S&P 500 Index. The bottom line: Historically, the risk of economic decline is low if the stock market has been higher over the past 12 months.
Conversely, the chart below displays the cumulative % gain for the Coincident Economic Index if we only count months following a 12-month decline for the S&P 500 Index. The bottom line: An economic decline is not guaranteed following a 12-month decline by the S&P 500 Index, but the odds are much greater.

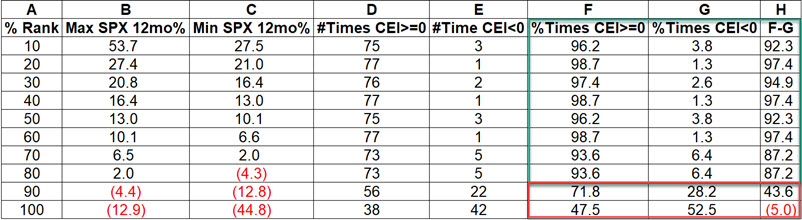
Let's dive back into the numbers to emphasize the point. The table below ranks every 12-month percentage change for the S&P 500 Index from highest to lowest since 1959 and breaks it into ten deciles. For each decile, we note the number of times (and percentage of times) the Coincident Economic Index showed a gain in the following month.
The bottom line: The worse the 12-month performance of the S&P 500 Index, the more likely subsequent economic weakness will occur.
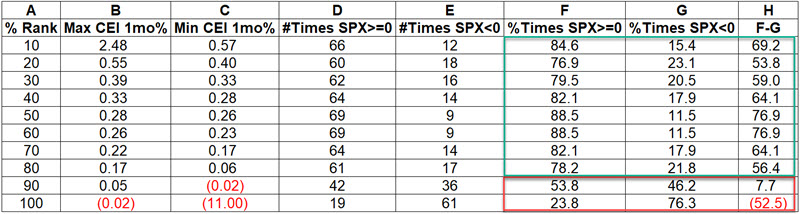
Finally, to cover all the bases, the table below ranks every 1-month % change for the Coincident Economic Index from highest to lowest since 1959 and breaks it into ten deciles. For each decile, we note the number of times (and percentage of times) the S&P 500 Index showed a gain in the 12 months just prior.
The bottom line: The conclusion is the same-the worse the performance of the Coincident Economic Index, the more likely the S&P 500 was to have performed poorly over the year prior.
What the research tells us…
If you want to impress your friends with your ability to "predict" economic weakness, history suggests waiting for the S&P 500 Index to show a 12-month loss before doing so. Note that doing so does not guarantee that you will be proven correct, but it does appear to improve your odds significantly. Likewise - and probably more importantly - history strongly suggests ignoring dire warnings of "impending recession" or "economic collapse" while the stock market is performing well.