Data &
Technology
Research
Reports
Report Solutions
Reports Library
Actionable
Strategies
Free
Resources
Simple Backtest Calculator
Simple Seasonality Calculator
The Kelly Criterion Calculator
Sentiment Geo Map
Public Research Reports
Free Webinar
Pricing
Company
About
Meet Our Team
In the News
Testimonials
Client Success Stories
Contact
Log inLoginSign up
< BACK TO ALL REPORTS

The start of 2022 suggests a good year for Energy and Value

Jason Goepfert
2022-01-14
The first 5 days of 2022 saw a surge in Energy and Financials, which have a good record at continuing into year-end. Foreign markets are surging relative to the U.S.

The dollar loses its medium-term trend

A well-known seasonal pattern, originated by Stock Trader's Almanac, suggests that how investors behave in the first 5 days of a new year sets the tone for the rest of the year.

In theory, this is silly. There is no reason why such a short-term move would have any impact on returns nearly 12 months later. In practice, it's not so easy to dismiss.

Instead of rehashing the familiar, let's look at sectors and factors and see if there is any reason to be especially bullish or bearish on their prospects for the rest of this month and this year depending on how they were treated during that first week. Based on that theory, things are looking good for Energy, Financial, and Value stocks. High-beta investors might have a reason to worry.

The first 5 days of 2022

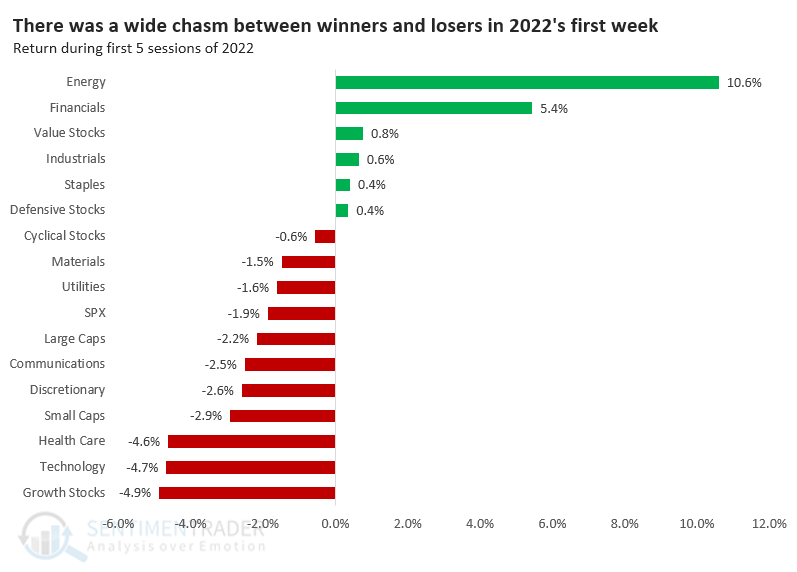
When we look at how first-week winners performed for the rest of the month and the rest of the year, the results were good. 

Taking first place was Energy, which added to its gains during the rest of the month only 52% of the time, but during the other approximately 247 other days in the year, it rose a whopping 90% of the time. 

Stat box

 Despite relatively mild losses in the Nasdaq 100, only 54% of its member stocks are trading above their 200-day moving averages. That's tied for the lowest amount since May 2020.


Most commodities are above their averages

Value has been surging relatively to Growth, and that's impacting overseas markets relative to domestic ones.

The MSCI ACWI Index leans more toward growth-oriented groups. In contrast, the MSCI ACWI ex USA Index favors value. So, when comparing a USA-dominated world index to the world ex USA index, it's one big growth versus value trade.

Dean assessed the outlook for the MSCI ACWI ex USA Index (a value trade) when 90% or more global country ETFs outperform the S&P 500. He used a 21-day rolling return to calculate the percentage of foreign markets exceeding the S&P 500.

Percentage of foreign markets outperforming the U.S. has surged

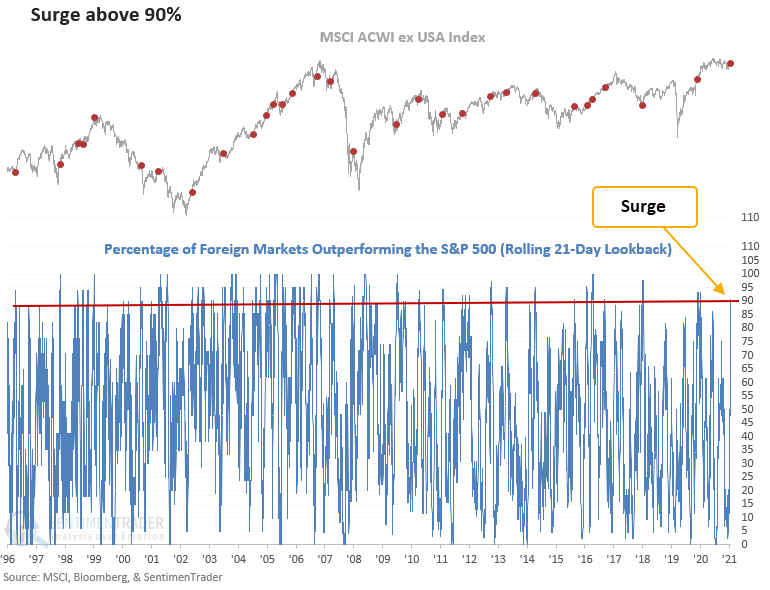
This signal has triggered 30 other times over the past 25 years. After the others, future returns, win rates, and z-scores look solid across medium and long-term time frames, especially the 1-month window. 

Results after a swift reversal in the percentage of markets outperforming were even more compelling.

DATA &
TECHnologies
IndicatorEdge
‍
BackTestEdge
‍
Other Tools
‍
DataEdge API
RESEARCH
reports
Research Solution
‍
Reports Library
‍
actionable
Strategies
Trading Strategies
‍
Smart Stock Scanner
‍
FREE
RESOUrCES
Simple Backtest
Calculator
Simple Seasonality
Calculator
The Kelly Criterion
Calculator
Sentiment Geo Map
‍
Public Research Reports
‍
Free Webinar
COMPANY
‍
About
‍
Meet our Team
‍
In the News
‍
Testimonials
‍
Client Success Stories
Pricing
Bundle pricing
‍
Announcements
‍
FAQ
© 2024 Sundial Capital Research Inc. All rights reserved.
Setsail Marketing
TermsPrivacyAffiliate Program
Risk Disclosure: Futures and forex trading contains substantial risk and is not for every investor. An investor could potentially lose all or more than the initial investment. Risk capital is money that can be lost without jeopardizing ones’ financial security or life style. Only risk capital should be used for trading and only those with sufficient risk capital should consider trading. Past performance is not necessarily indicative of future results.

Hypothetical Performance Disclosure: Hypothetical performance results have many inherent limitations, some of which are described below. No representation is being made that any account will or is likely to achieve profits or losses similar to those shown; in fact, there are frequently sharp differences between hypothetical performance results and the actual results subsequently achieved by any particular trading program. One of the limitations of hypothetical performance results is that they are generally prepared with the benefit of hindsight. In addition, hypothetical trading does not involve financial risk, and no hypothetical trading record can completely account for the impact of financial risk of actual trading. for example, the ability to withstand losses or to adhere to a particular trading program in spite of trading losses are material points which can also adversely affect actual trading results. There are numerous other factors related to the markets in general or to the implementation of any specific trading program which cannot be fully accounted for in the preparation of hypothetical performance results and all which can adversely affect trading results.

Testimonial Disclosure: Testimonials appearing on this website may not be representative of other clients or customers and is not a guarantee of future performance or success.