Data &
Technology
Research
Reports
Report Solutions
Reports Library
Actionable
Strategies
Free
Resources
Simple Backtest Calculator
Simple Seasonality Calculator
The Kelly Criterion Calculator
Sentiment Geo Map
Public Research Reports
Free Webinar
Pricing
Company
About
Meet Our Team
In the News
Testimonials
Client Success Stories
Contact
Log inLoginSign up
< BACK TO ALL REPORTS

The S&P's Inflation Adjusted Yield Just Plunged to a Record Low

Jason Goepfert
2021-05-26
The inflation-adjusted yield from dividends and earnings that an investor is getting in the S&P 500 has plunged to a 50-year low. Using just earnings, the yield is negative. All five of the other times this happened preceded declines in stocks.

Whatever one thinks about the outlook for inflation, it's hard to debate the idea that it's already here. Using traditional ways of measurement, virtually all of them are high and rising.

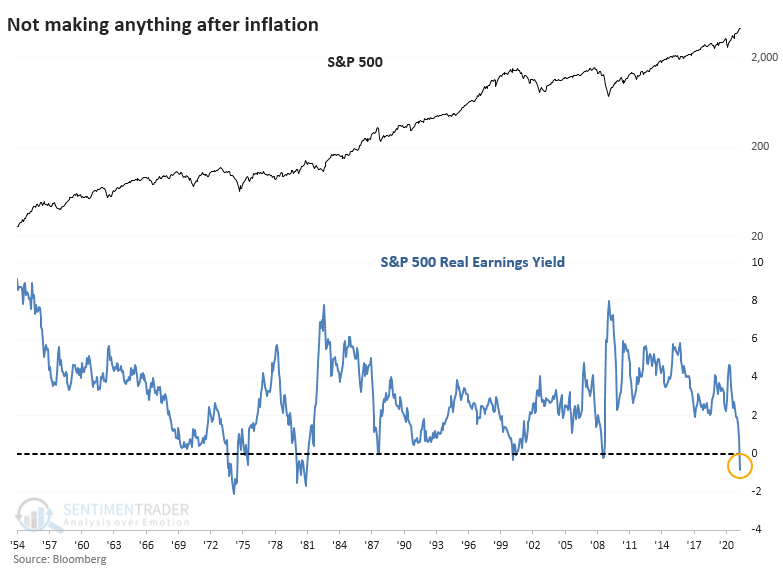
Until recently, one of the main arguments for stocks was that even though they weren't yielding much, at least they were earning more than Treasuries, even after accounting for inflation.

Now that there has been a spike in inflation gauges, the earnings yield on the S&P 500 has turned negative. This is not a condition that investors have had to tackle much over the past 70 years.

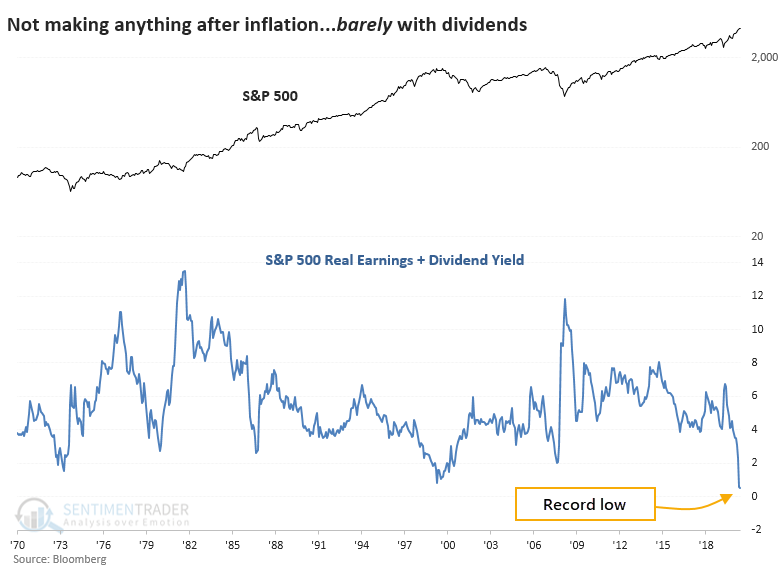
When an investor in the S&P adds up her dividend check and share of earnings, then subtracts the loss of purchasing power from inflation, she's barely coming out even. This is a record low, dating back to 1970, just eclipsing the prior low from March 2000.

NEGATIVE REAL YIELDS = TROUBLE

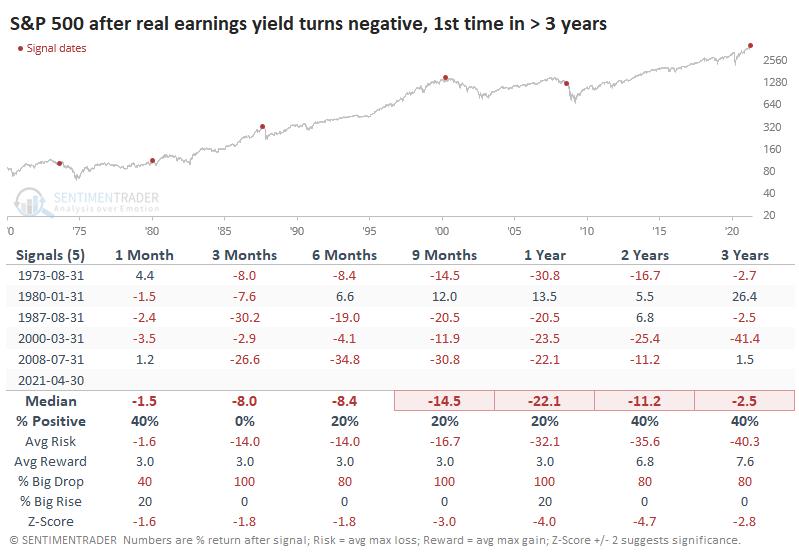
If we ignore dividends, then there have been five other times when the S&P 500's inflation-adjusted earnings yield turned negative. You may want to close one eye and use the other to look askance at the table because it's not pretty.

The Risk/Reward table shows just how limited the upside was.

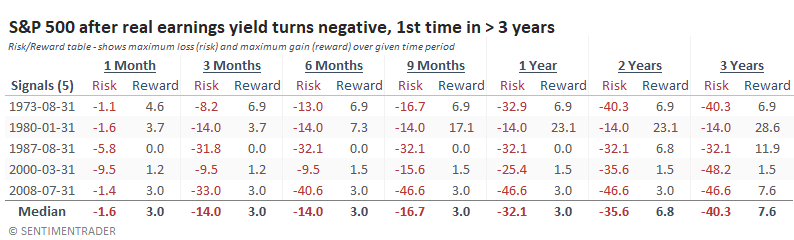
The S&P failed to rally more than 7% at its best point within the next two years after all but one signal, from January 1980. That time, the S&P suffered a quick correction then rallied strongly in the year ahead (and then failed again). All the others showed maximum drawdowns of -32% or more. Ouch.

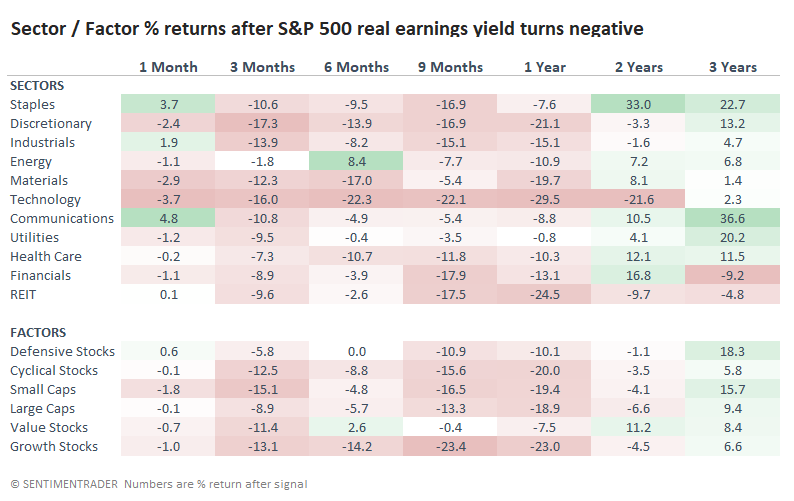
TECH TROUBLES, VALUE PREFERENCE

As Jay showed last week, inflation has had an especially pernicious effect on Technology stocks. And when we look at the average returns in sectors and factors following these same signals, the worst returns were, indeed, in Tech, Discretionary, and Growth stocks. There weren't exactly any winners, but the "best losers" included Value, Staples, Energy, and Utilities. Not a big surprise.

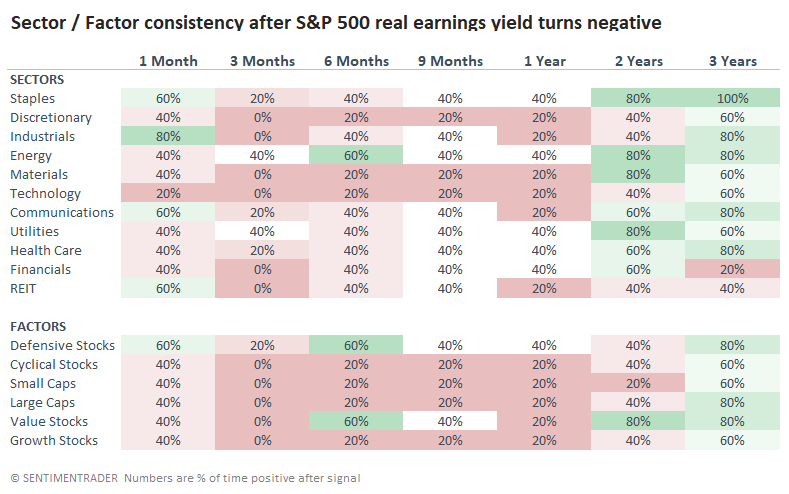
If we look at sector and factor consistency instead, it's a similar story. This is the percentage of time that each showed a positive return over the time frames. With a sample size of only five, it's not as informative as it would be with more precedents.

The biggest risk with putting weight on data like this is the this-time-is-different argument due to unprecedented stimulus, an unusually active central bank, and problems with measuring inflation, especially a base rate that's being so influenced by a once-in-a-century pandemic.

While acknowledging that history is never a perfect guide, we'd rather use it as a guide than pure guesses about why it's not valid. And this history is waving a major red flag for the long-term.

Sorry, you don't have access to this report

Upgrade your subscription plan to get access
Go to Dasboard
DATA &
TECHnologies
IndicatorEdge
‍
BackTestEdge
‍
Other Tools
‍
DataEdge API
RESEARCH
reports
Research Solution
‍
Reports Library
‍
actionable
Strategies
Trading Strategies
‍
Smart Stock Scanner
‍
FREE
RESOUrCES
Simple Backtest
Calculator
Simple Seasonality
Calculator
The Kelly Criterion
Calculator
Sentiment Geo Map
‍
Public Research Reports
‍
Free Webinar
COMPANY
‍
About
‍
Meet our Team
‍
In the News
‍
Testimonials
‍
Client Success Stories
Pricing
Bundle pricing
‍
Announcements
‍
FAQ
© 2024 Sundial Capital Research Inc. All rights reserved.
Setsail Marketing
TermsPrivacyAffiliate Program
Risk Disclosure: Futures and forex trading contains substantial risk and is not for every investor. An investor could potentially lose all or more than the initial investment. Risk capital is money that can be lost without jeopardizing ones’ financial security or life style. Only risk capital should be used for trading and only those with sufficient risk capital should consider trading. Past performance is not necessarily indicative of future results.

Hypothetical Performance Disclosure: Hypothetical performance results have many inherent limitations, some of which are described below. No representation is being made that any account will or is likely to achieve profits or losses similar to those shown; in fact, there are frequently sharp differences between hypothetical performance results and the actual results subsequently achieved by any particular trading program. One of the limitations of hypothetical performance results is that they are generally prepared with the benefit of hindsight. In addition, hypothetical trading does not involve financial risk, and no hypothetical trading record can completely account for the impact of financial risk of actual trading. for example, the ability to withstand losses or to adhere to a particular trading program in spite of trading losses are material points which can also adversely affect actual trading results. There are numerous other factors related to the markets in general or to the implementation of any specific trading program which cannot be fully accounted for in the preparation of hypothetical performance results and all which can adversely affect trading results.

Testimonial Disclosure: Testimonials appearing on this website may not be representative of other clients or customers and is not a guarantee of future performance or success.