
The S&P 500's exceptional Sharpe ratio may have peaked

Key points:
- The S&P 500's Sharpe ratio neared one of the best levels in history and is rolling over
- Other times it peaked at a high level, the index saw more volatility with moderate returns
- Consumer staple and value stocks tended to show the best returns among sectors and factors
The past six months have been some of the best
Investors have had it awfully easy for a long time, even though it may be tough to convince someone trading through recent pre-market moves.
In July 2021, we'd been asked with increasing frequency if the "easy" rally was so easy that it was about to become difficult. And there was something to that.
Here we are again, with more and more questions about U.S. stocks' outsized gains with relatively tame volatility. Using a version of the Sharpe Ratio, the S&P 500 has seen the best risk-adjusted returns since late 2021. From Investopedia (edited for brevity):
The Sharpe ratio was developed by Nobel laureate William F. Sharpe and is used to help investors understand the return of an investment compared to its risk. The ratio is the average return earned in excess of the risk-free rate per unit of volatility or total risk. Volatility is a measure of the price fluctuations of an asset or portfolio.
Subtracting the risk-free rate from the mean return allows an investor to better isolate the profits associated with risk-taking activities. Generally, the greater the value of the Sharpe ratio, the more attractive the risk-adjusted return.
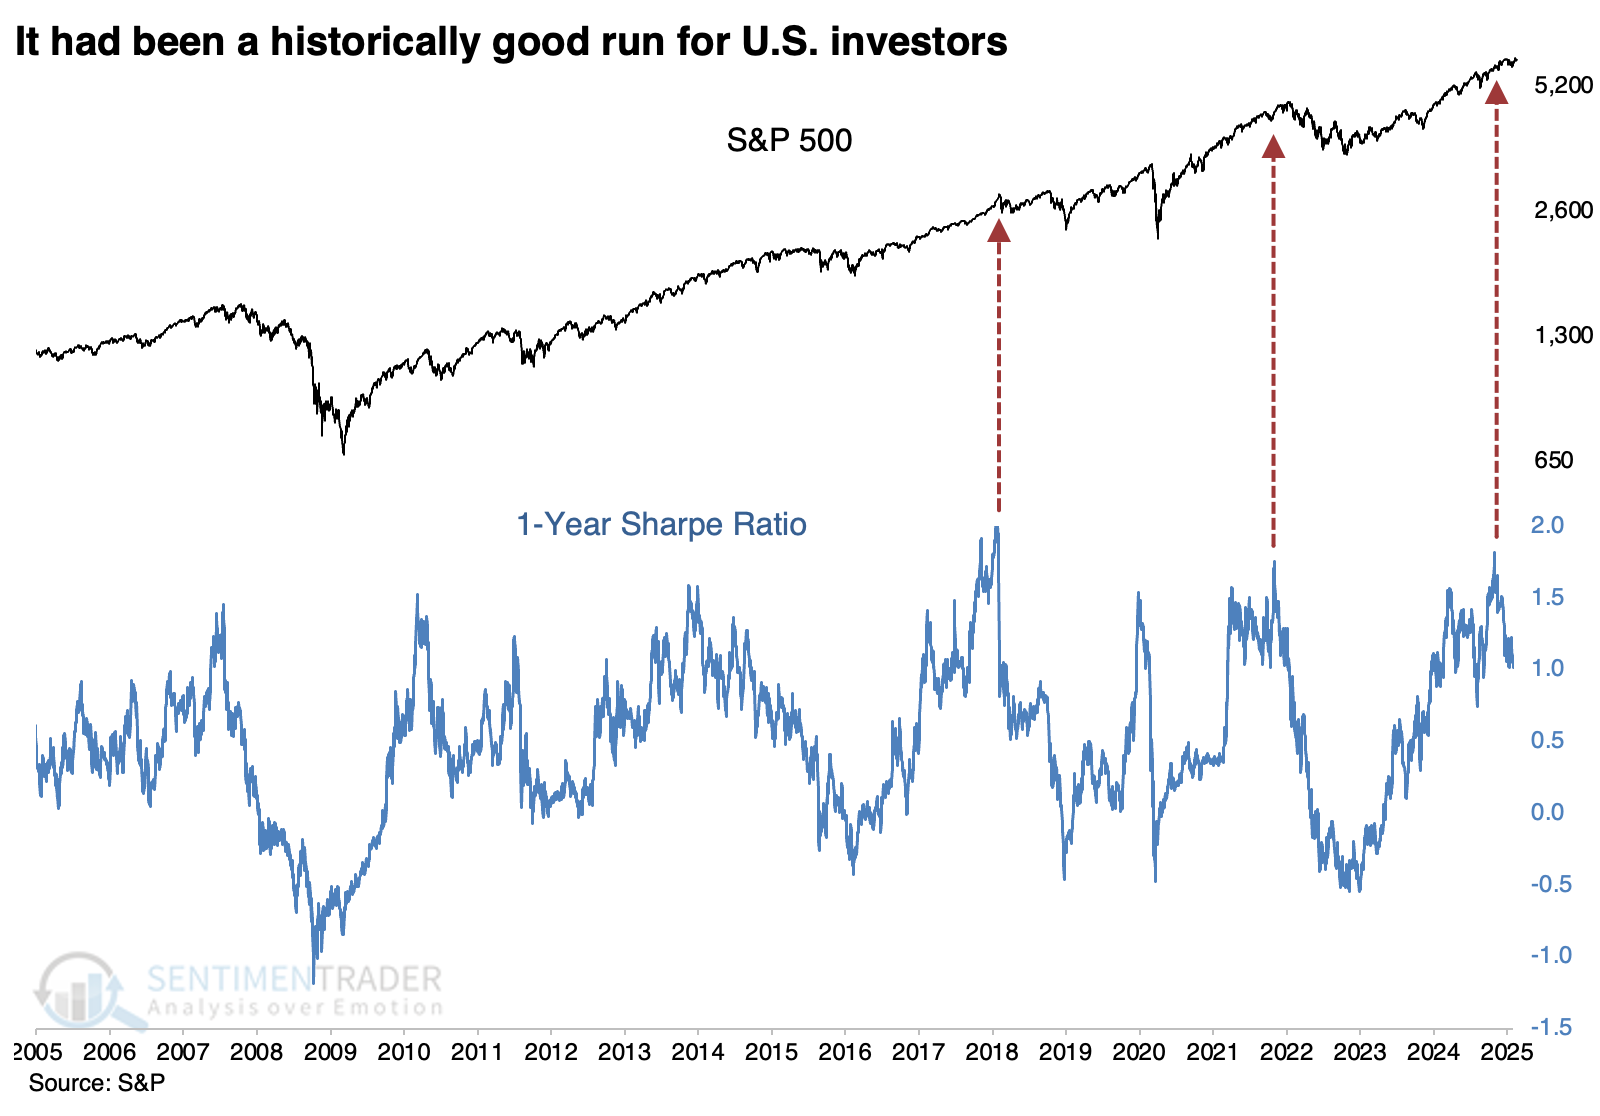
The ratio's calculation methodology varies, and its use is subject to debate. However, it's still a handy way to determine just how ideal market conditions have been for investors. As shown below, the Sharpe ratio recently approached 2.0 for the third time in the past two decades. The other two weren't good times to extrapolate the gains into the future.
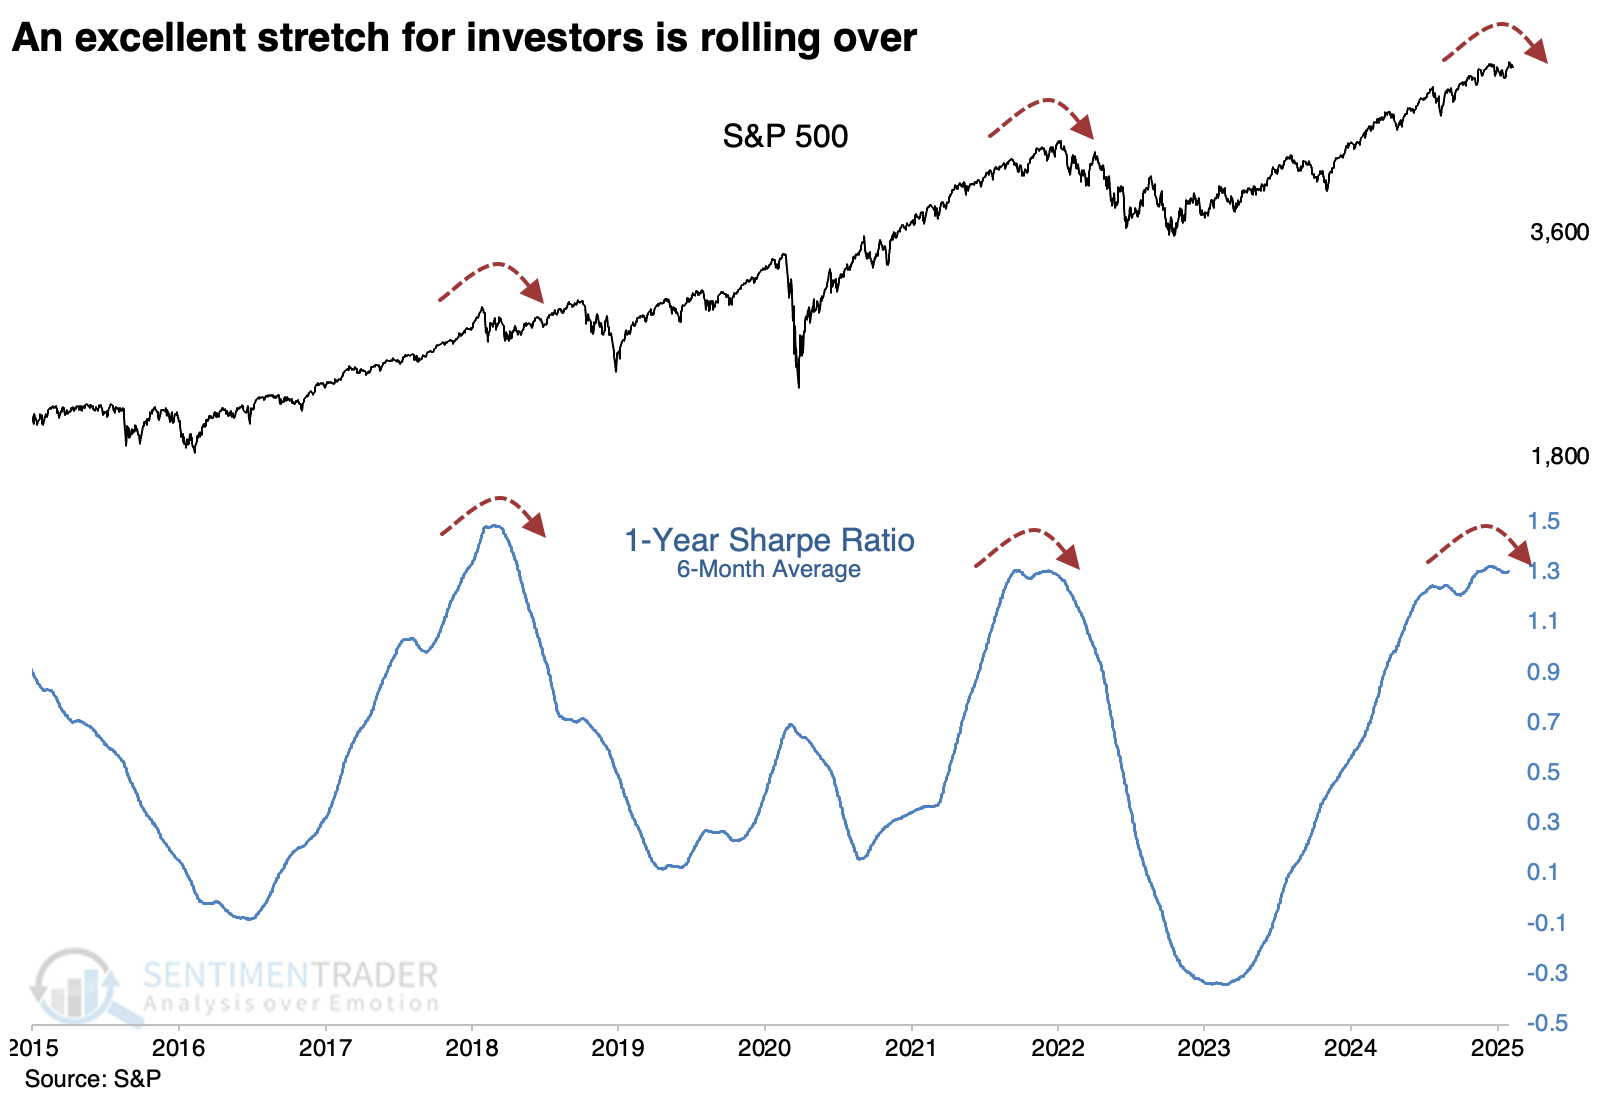
The ratio can be jumpy, so we'll apply a six-month average to the Sharpe ratio to take a longer-term view. Below, we can see that this average appears to be rolling over, as it did in 2018 and 2021.
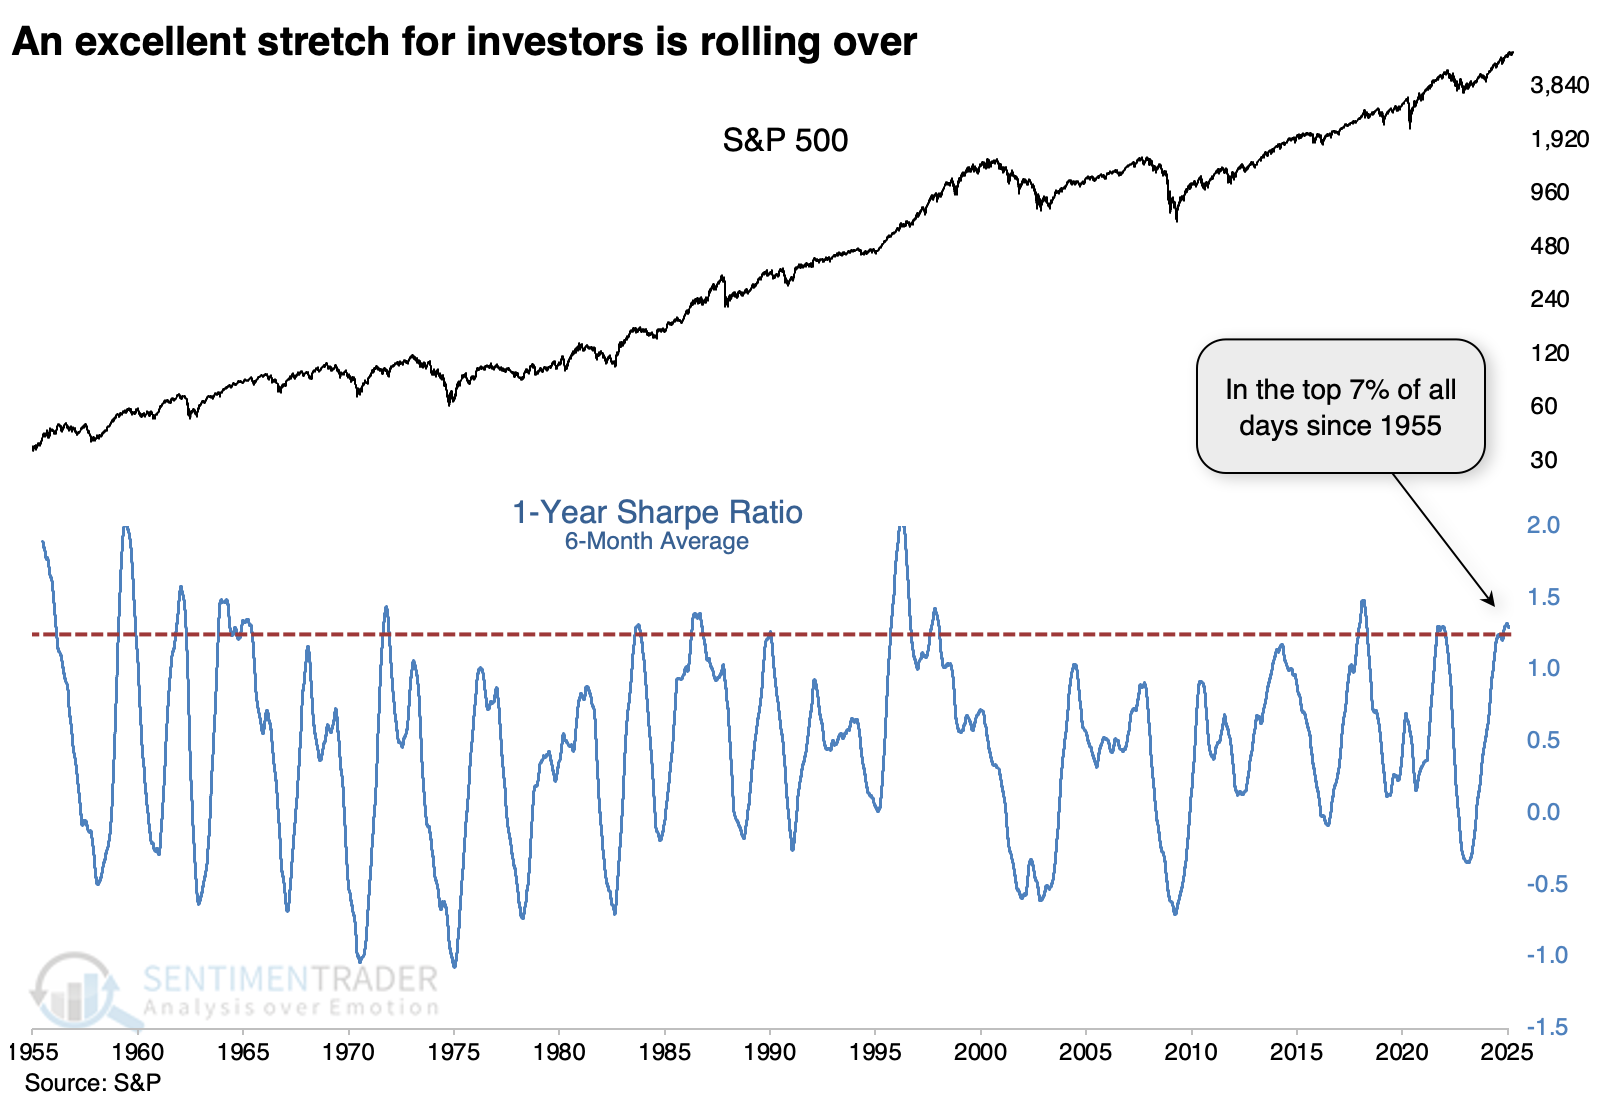
Zooming out to view the past 70 years, we see that the recent average ranked in the top 7% of all days. It has since started to roll over, suggesting an end to the exceptionally accommodative conditions for investors.
Determining when an indicator has peaked is mostly subjective. It's easy to identify in hindsight, but we need some objective metric in real-time. For these purposes, we'll highlight when the 6-month average of the S&P 500's Sharpe ratio exceeded 1.2, the highest level in more than a year, and didn't set another new high for at least 30 days.
Using those criteria, we're at a point that suggests the ratio has peaked. That doesn't mean it can't reverse again and head even higher - it has done so several times in the past - but it's a decent suggestion that either returns will moderate or volatility will increase (or both).
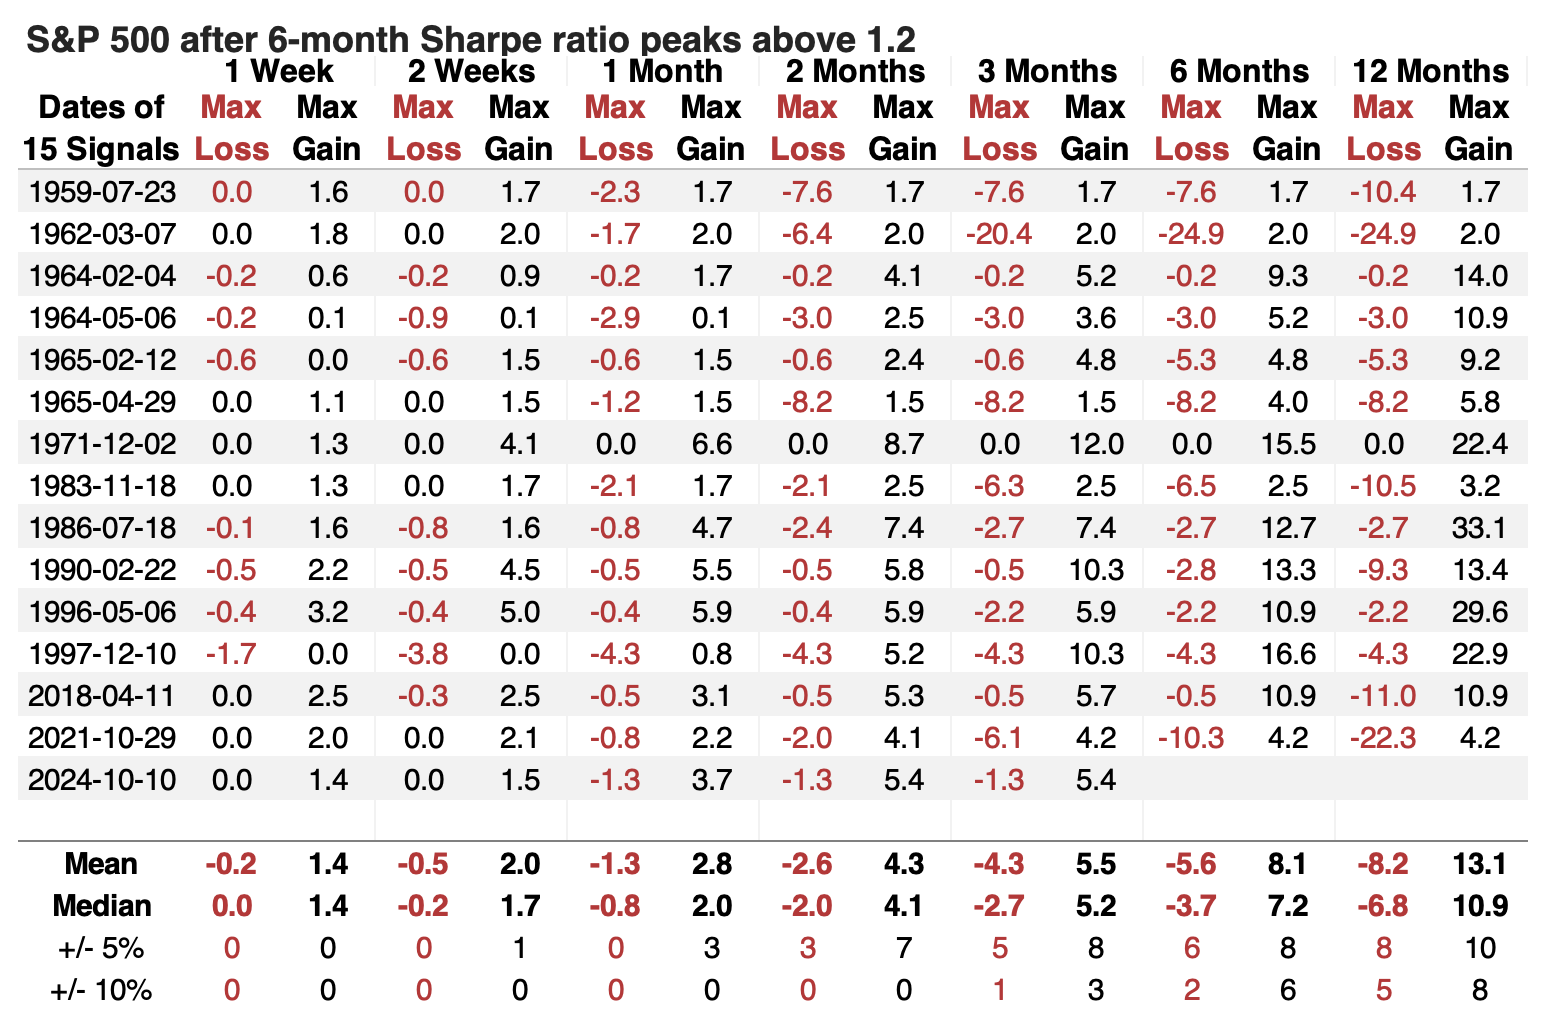
The table below shows that after other peaks, "moderate" returns didn't necessarily mean "negative." The S&P's returns were mostly below average, and its risk/reward profile wasn't impressive, but it still showed positive returns most of the time across all time frames.
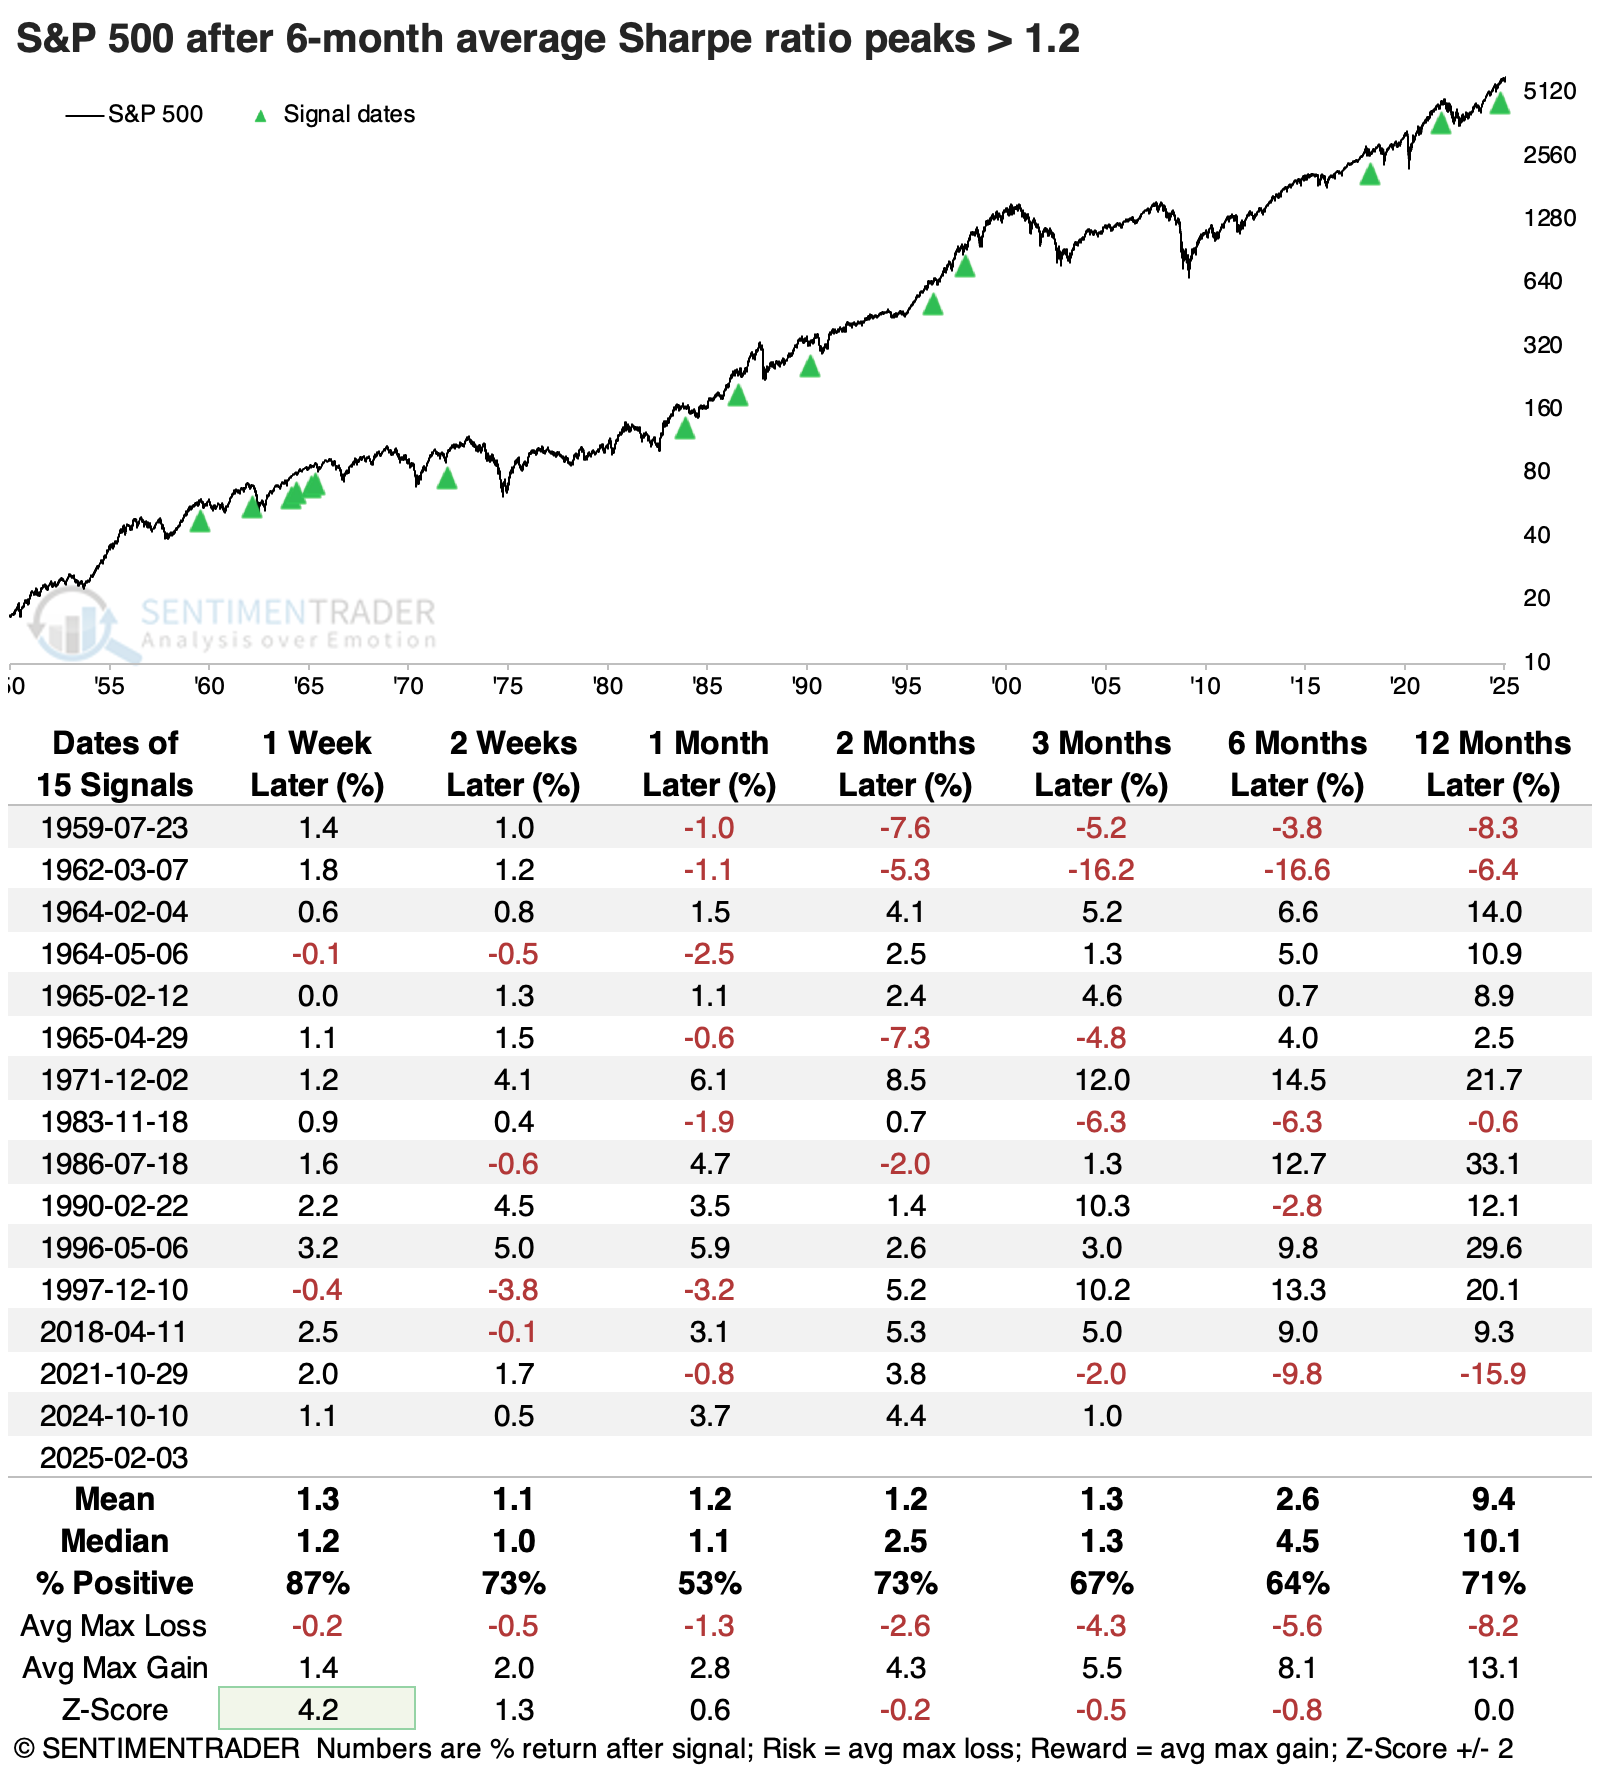
The table of maximum gains and losses across time frames shows that the S&P fell more than -10% within the next six months only twice while gaining more than +10% six times. Over the following year, moderate to large gains and losses were more evenly balanced.
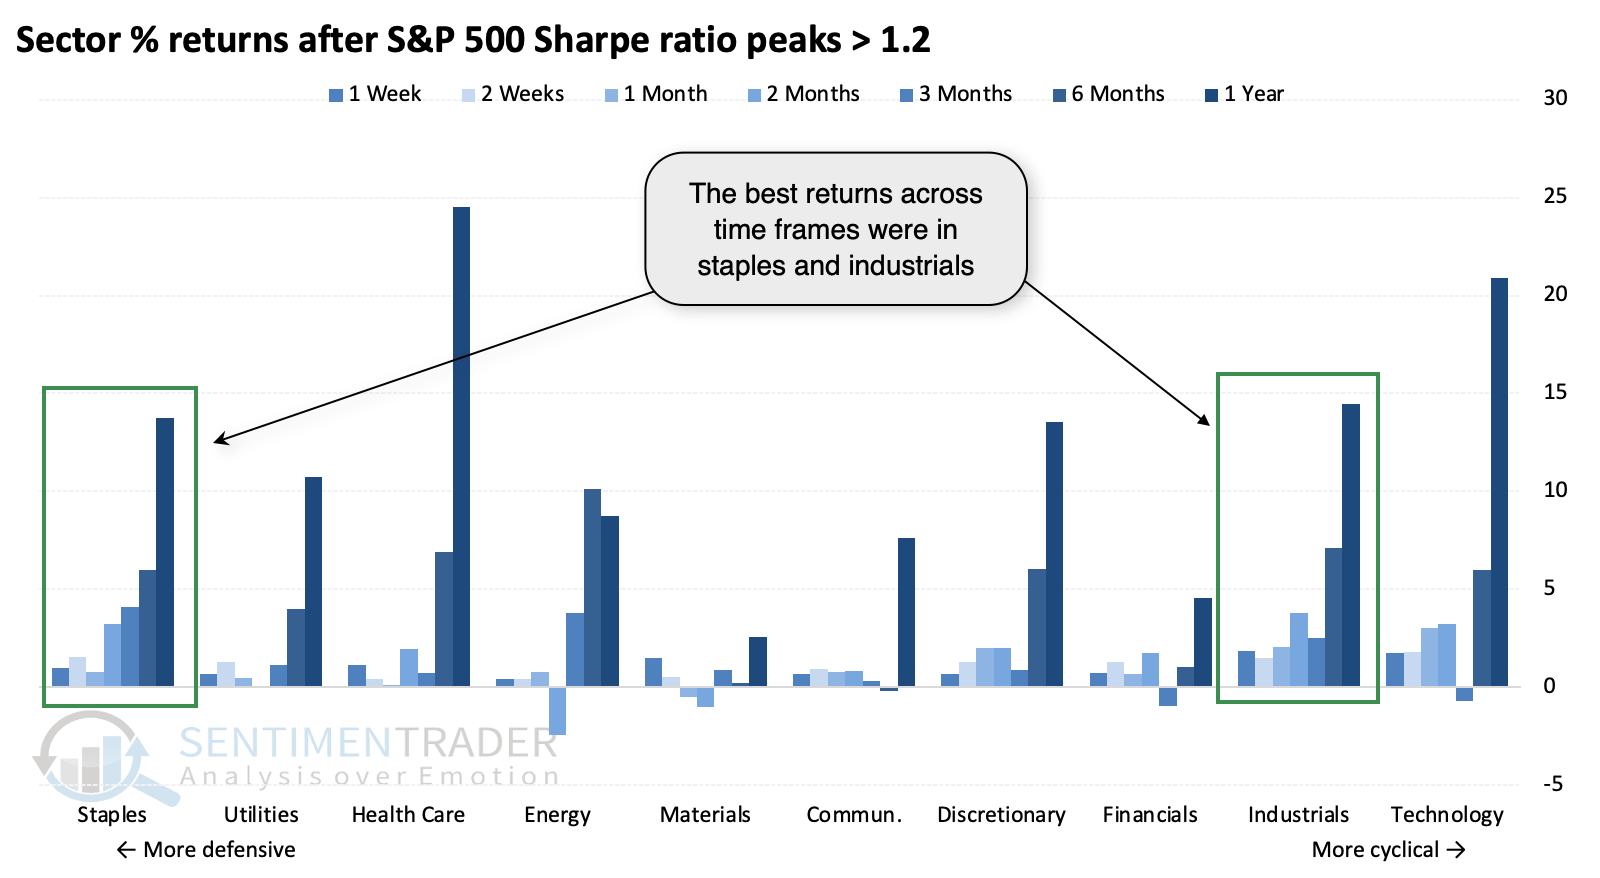
Good for staples and value
Among sectors, the best returns across time frames were in staples and industrials, on opposite ends of the defensive-cyclical spectrum.
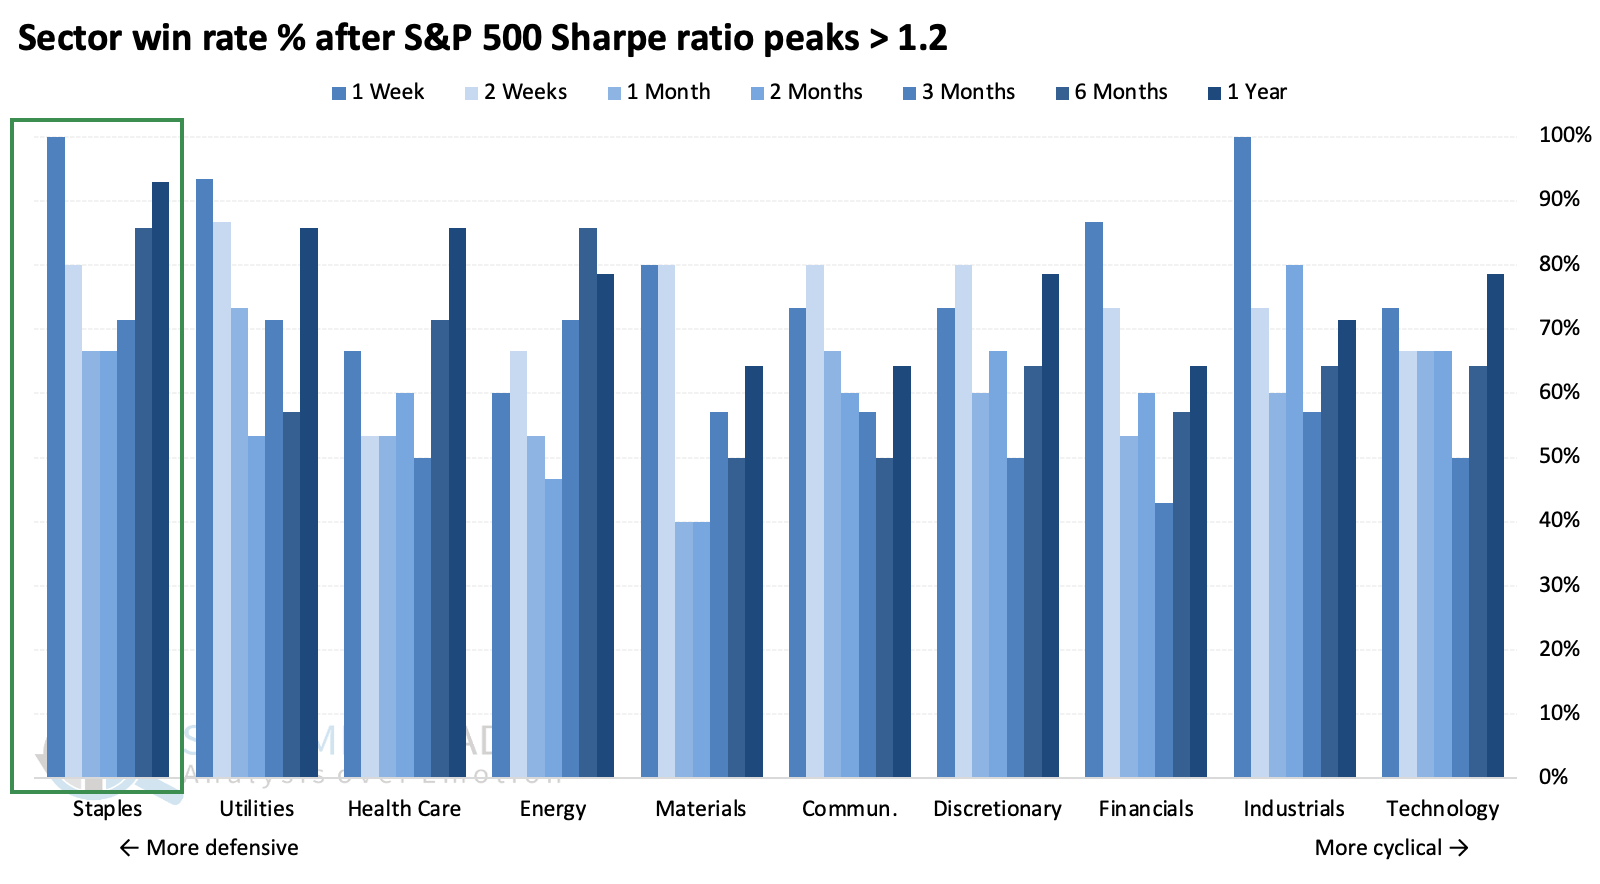
However, in terms of win rate, staples came out on top. It's the only sector with a win rate over 65% across every time frame.
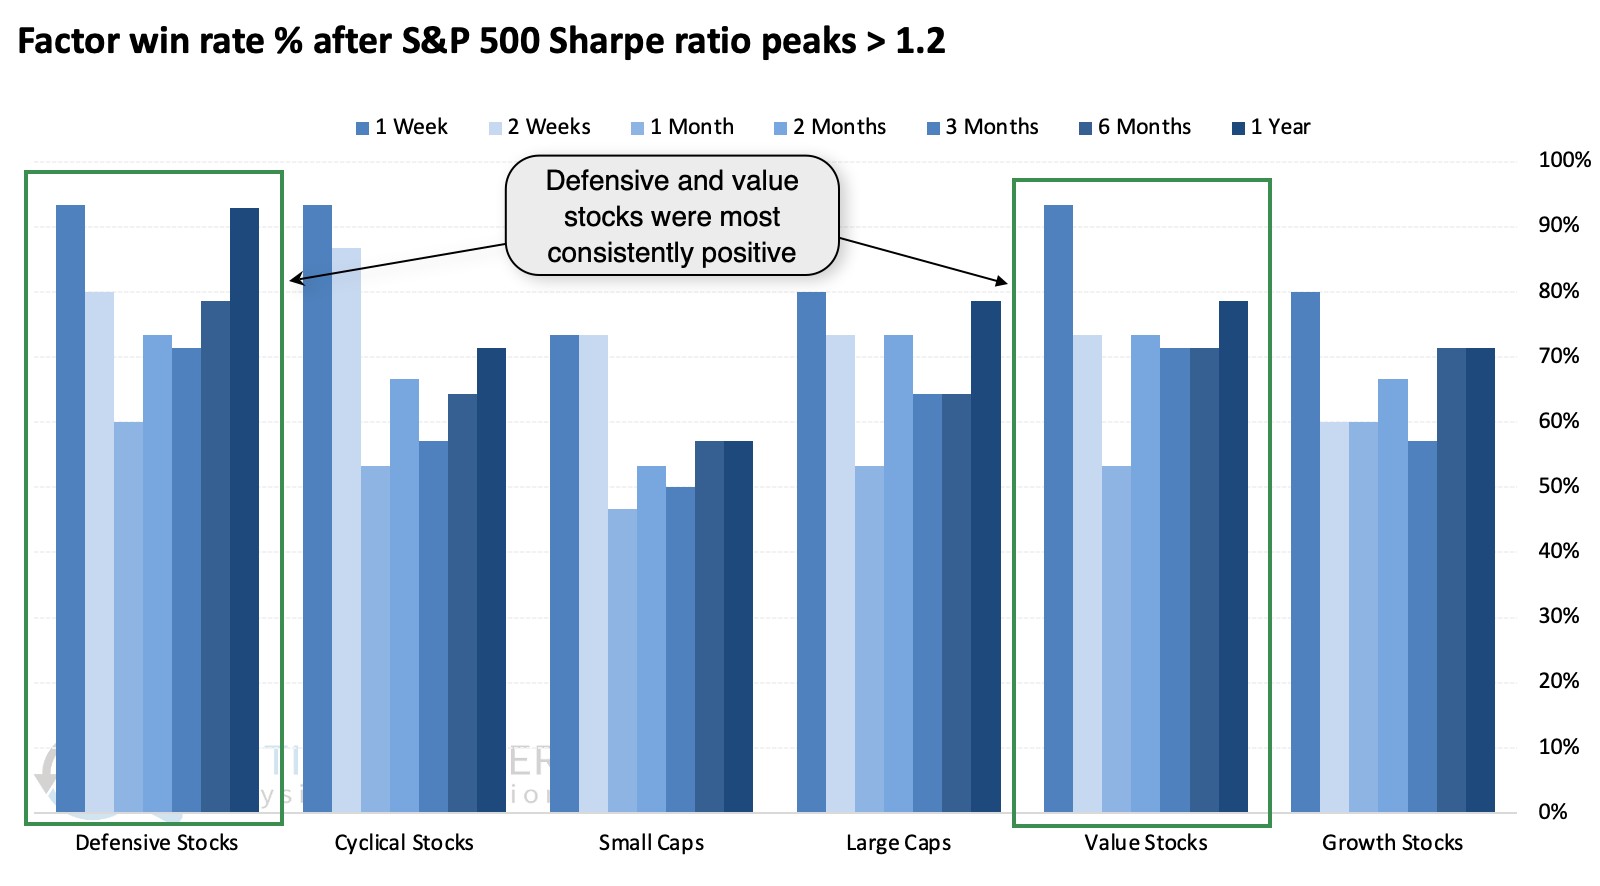
If we take a broader look at factors, value stocks were the biggest winner; they had the largest median return three, six, and twelve months later.
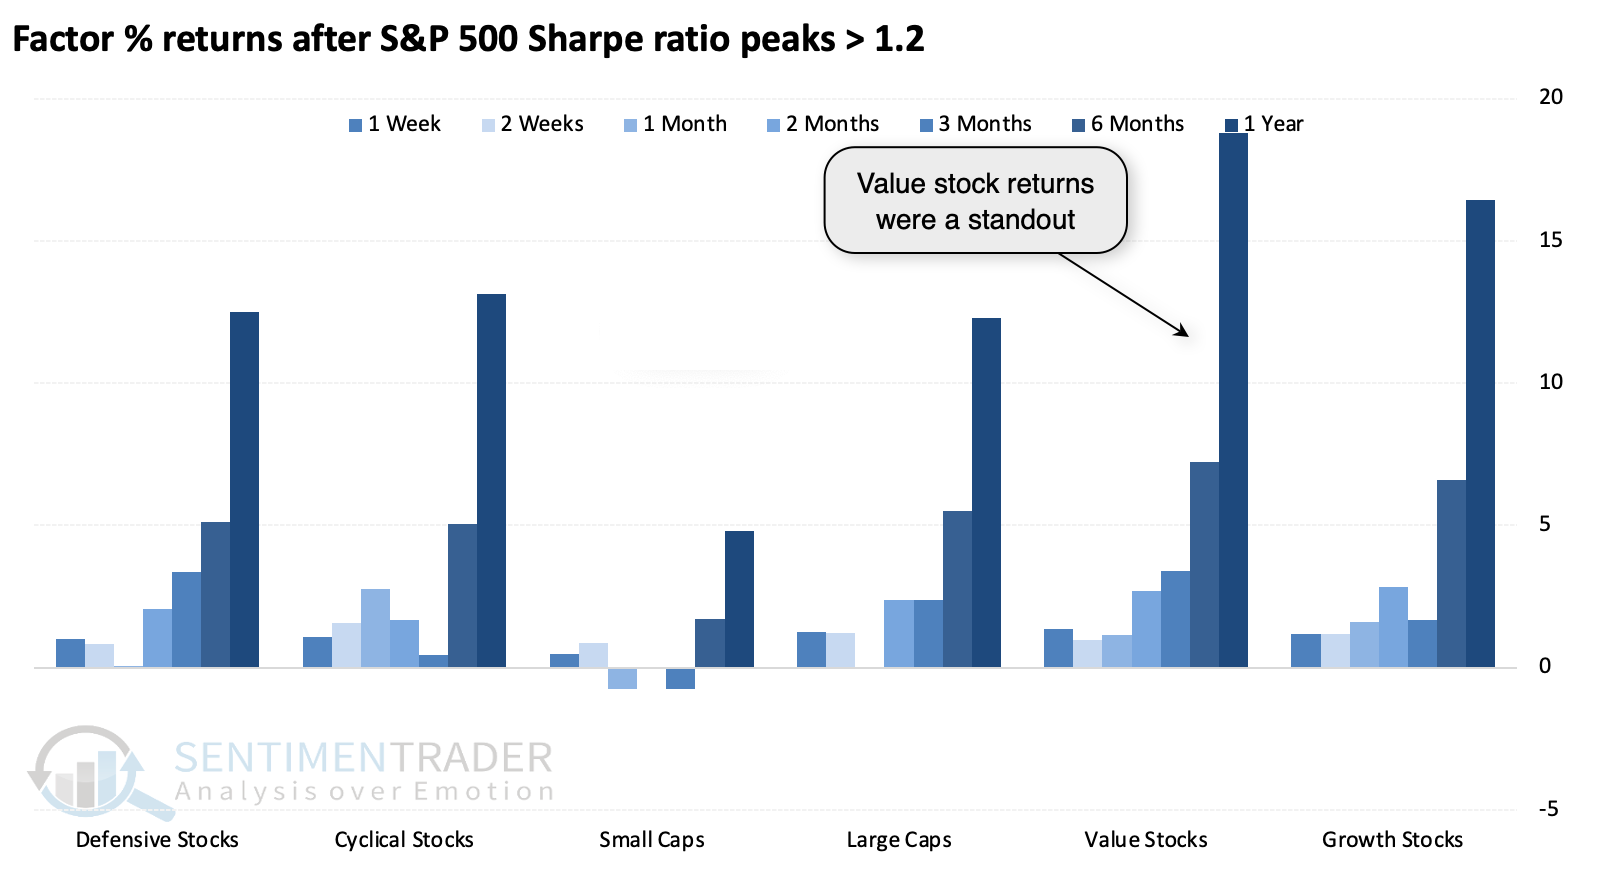
While value stocks enjoyed the largest returns, defensive stocks were more consistently positive across time frames.
What the research tells us...
When the going gets easy for investors, it's natural to let one's guard down and become complacent. That's a dangerous condition for all but the longest-term, long-term, unleveraged investors. Markets can be their most dangerous when they look the safest.
Using the Sharpe ratio as a proxy for how good it's been for U.S. investors, we see above that there aren't many times in history when it's been better than the past six months, and there are signs that it's ending. That can mean more volatility, but it doesn't necessarily mean negative returns. The biggest takeaway has been moderate returns, with much more of a two-way market than investors had gotten used to in the months prior.