
The S&P 500 has never been lower after this price momentum signal

Key points:
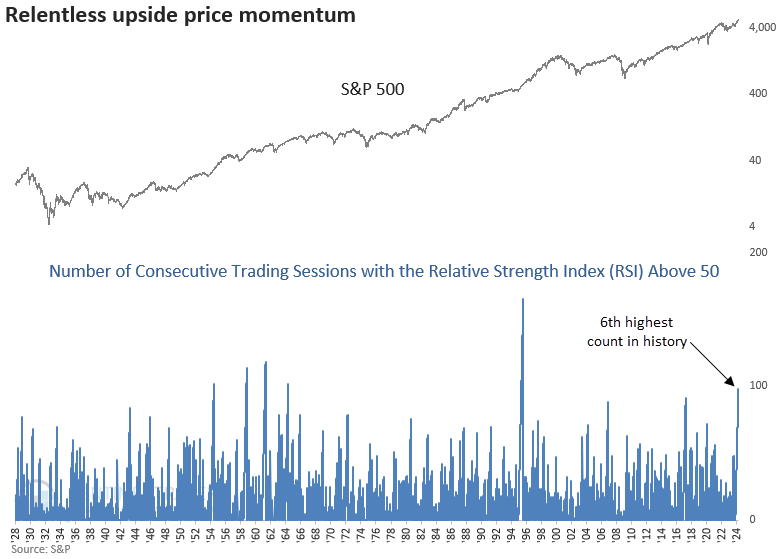
- The S&P 500's Relative Strength Index has closed above a value of 50 for 98 straight trading sessions
- Similar price momentum preceded a 100% win rate over the following two, three, six, and twelve months
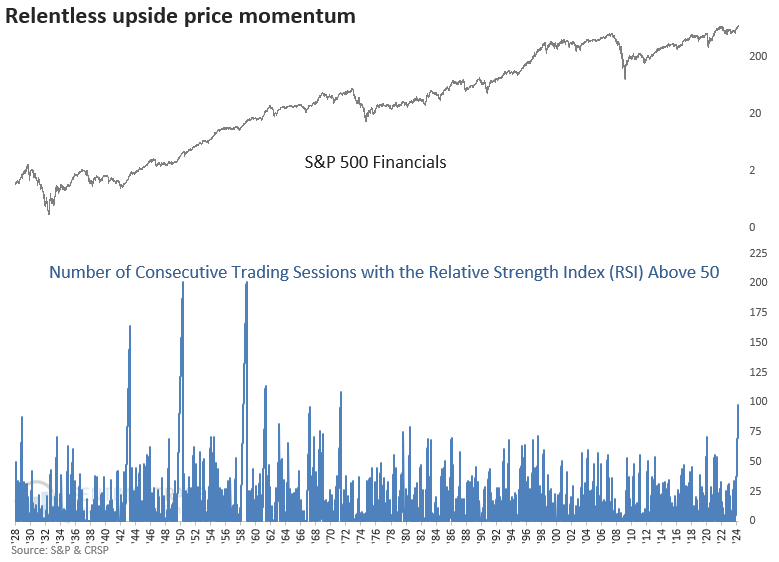
- The RSI range count for Financials has matched the S&P 500, with the highest reading since 1971
Bullish price momentum begets more bullish price momentum
The Relative Strength Index (RSI), created by J. Welles Wilder, is a popular technical indicator that measures price momentum. Too often, social media accounts and the press misrepresent the indicator's meaning, especially the overbought and oversold levels.
When the RSI reverses from oversold to overbought, it represents positive price momentum that will likely persist, a scenario that occurred last fall. My colleague, Jay Kaepell, highlighted this event in a research report.
Equally important after a bearish to bullish shift is the ability of the RSI indicator to sustain itself at a relatively high level, which also indicates bullish price momentum. Some analysts refer to this condition as a bull range.
After shifting above 50 last fall, the S&P 500's Relative Strength Index (RSI) has maintained a reading above that level for 98 consecutive trading sessions, the sixth-longest streak in history. The previous signal occurred in 2017 during a low volatility uptrend.
Similar RSI conditions produced excellent results for the S&P 500
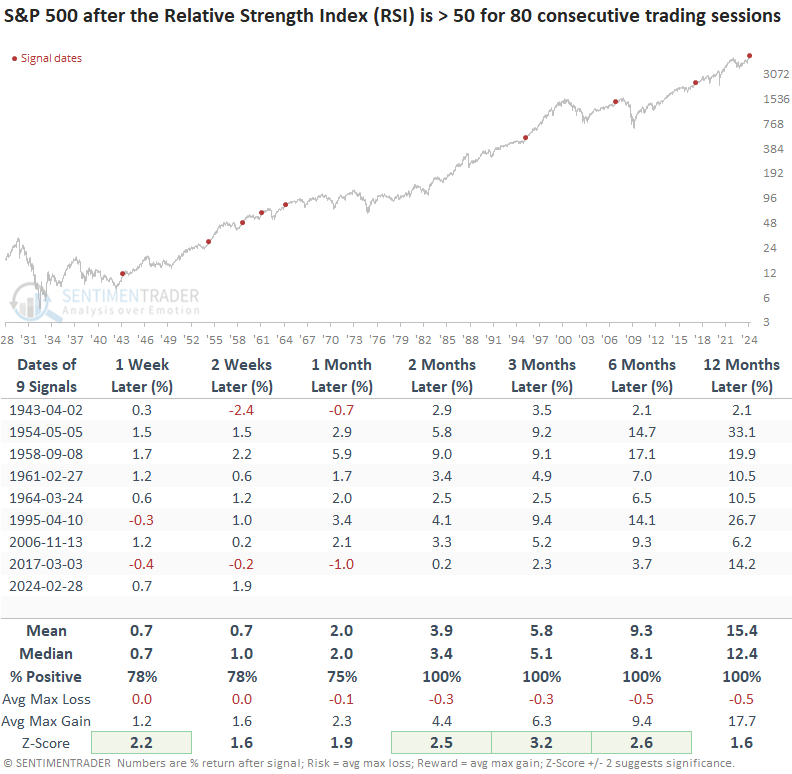
Once the RSI indicator persists above 50 for 80 consecutive trading sessions, the outlook for the world's most benchmarked index was nothing short of spectacular, maintaining an undefeated record over the following two, three, six, and twelve months.
While the overall sample size is small due to the rarity of this type of relentless momentum, two signals, 1995 and 2006, provide an interesting analog for those in the soft or hard landing camp. In both cases, the precedents occurred after the FOMC hit the pause button on a hiking cycle.
If you're in the hard landing camp akin to that of 2007-09, remember that the S&P 500 gained 13% over the subsequent 11 months before reaching its peak in October 2007.
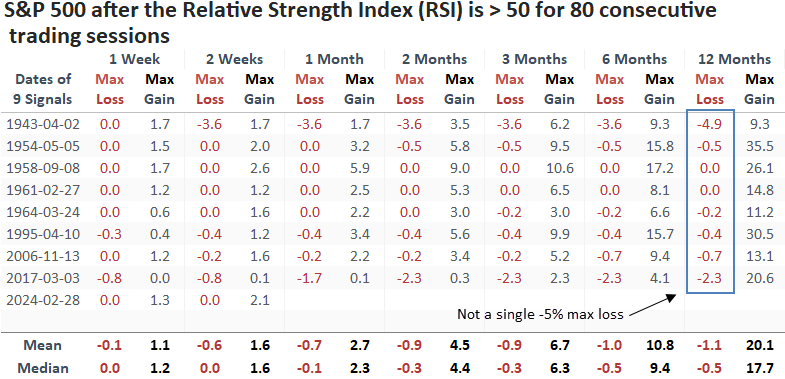
Over the next twelve months, the S&P 500 defied expectations by avoiding a maximum loss exceeding -5 %, a remarkable occurrence in my 25 years of analyzing trading signals.
An equally impressive RSI range count from Financials
If a hard landing for the economy was right around the corner, I suspect the RSI range count for the S&P 500 Financials would not be on par with the S&P 500. Financials typically fire a warning shot across the bow well before economic contractions and bear markets. That's not the case now.
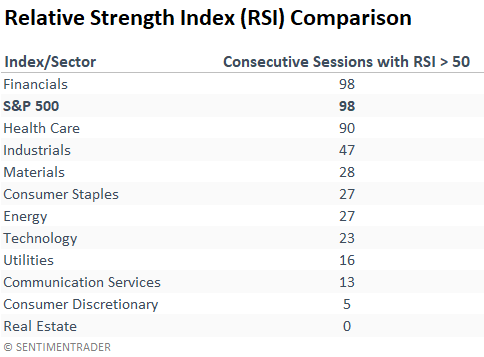
Financials have registered the 6th highest count in history, reaching the most significant level since 1971.
What the research tells us...
There is little doubt that the relentless rise in the S&P 500 over the last five months has been anything but outstanding. The Relative Strength Index (RSI), a measure of price momentum, has maintained a level above 50 for 98 straight trading sessions, an occurrence exceeded only five other times over the last 96 years. After similar precedents, the S&P 500 was higher every time over the ensuing two, three, six, and twelve months. So, despite all the calls for corrections and bear markets, history suggests the upside momentum persists.