The "safest" sector is doing something it's never done before
Utility stocks are acting high tech
A funny thing has been happening in stocks since late February. Stocks usually relegated to widows and orphans have behaved like supercharged tech stars.
According to Investopedia, Utility stocks are literally the definition of a safe, steady investment.
"Widow-and-orphan stock refers to an equity investment that often pays a high dividend and is moreover generally considered low-risk. These tend to be large, mature, stalwart companies in non-cyclical business sectors such as utilities and consumer staples, which tend to hold up better during economic downturns."
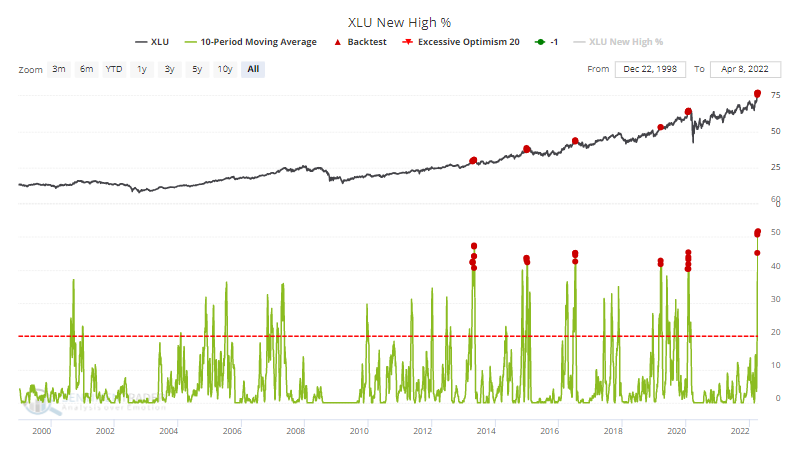
Hopefully, the past few weeks put some pep in the steps of those bereaved individuals, as the Dow Jones Utility Average has enjoyed its 2nd-largest 30-day rate of change in 20 years.
The jump pushed more than half of them to 52-week highs on an average day over the past 10 sessions, a 23-year record. The Backtest Engine shows that future returns are horrid when the 10-day average reaches even 40%. Of 24 days, only 1 barely eked out a positive return 2 months later.

Even more astounding, a 10-day period when more than half of Utility stocks hit a 52-week high is a record dating back 70 years. In other words, at no other time since 1952 have so many of these stocks hit new highs at the same time for such a long stretch.
If we put together a composite breadth indicator that incorporates 7 different factors, it just hit the 10th-highest reading since 1952.
Truck activity turns negative
When you boil it all down, stock market performance is essentially a function of economic growth. When the economy is growing, stocks typically advance and when the stock market gets a whiff of recession, stocks invariably decline.
Jay showed that the Heavy Truck Index (HTI) is a surprisingly helpful indicator for both stocks and the economy. It's a data series that tracks the number of newly registered heavy trucks with government agencies in the United States.
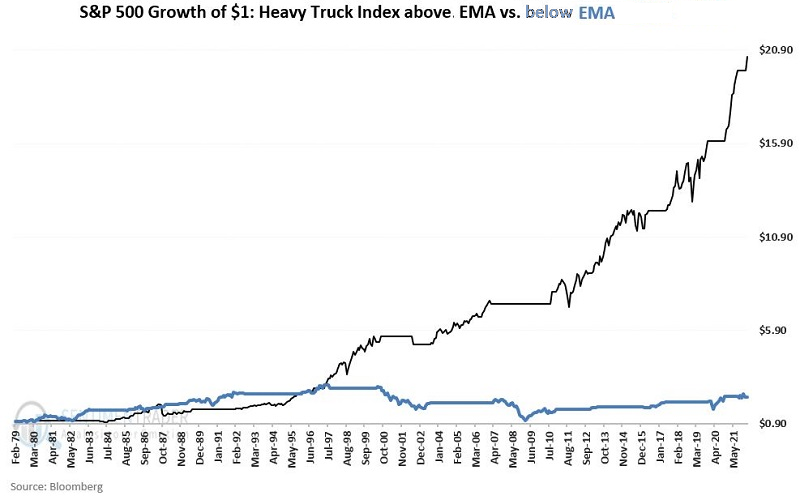
What is most important is the trend of the data. Economic forecasts are all well and good, but the real issue for investors is to be in the stock market at the right time. The chart below displays the growth of $1 invested in the S&P 500 Index when the HTI is above average (black line) versus below average (blue line).

For the record, the index is currently below its average, a headwind for stocks.


