
The RSI for the S&P 500 surges to a bullish overbought condition

Key points:
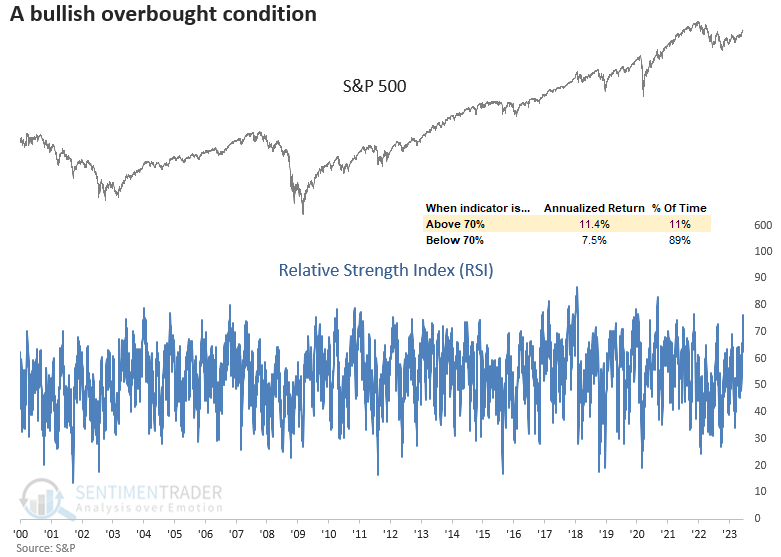
- The Relative Strength Index (RSI) for the S&P 500 surged above 76
- Bullish price momentum of this nature tends to fuel additional gains in the S&P 500
- When the RSI cycled from < 25 to > 76, like now, results were even more bullish
Bullish price momentum tends to beget more bullish price momentum
The Relative Strength Index (RSI), developed by J. Welles Wilder Jr., is a popular technical analysis indicator that measures market momentum. As per the traditional interpretation, an RSI reading of 70 or above signifies an overbought scenario, whereas a reading of 30 or below indicates an oversold condition.
According to conventional wisdom, purchasing stocks or assets that are oversold and selling those that are overbought is advisable.
In my interpretation, an RSI overbought condition is a favorable setup as it denotes positive momentum. In contrast, an oversold reading is unfavorable as it indicates negative momentum. So, I embrace overbought conditions, which the data confirms.
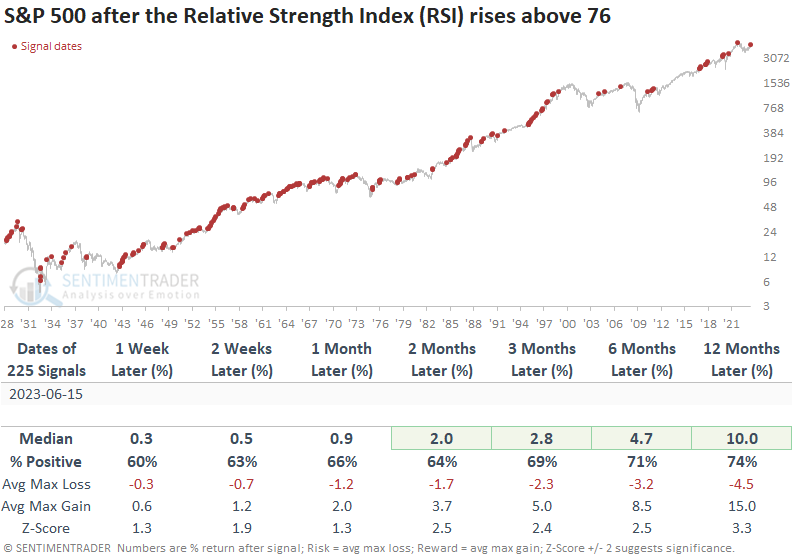
Similar overbought conditions have historically resulted in positive returns
The Relative Strength Index has risen above 76, a total of 226 times since 1928. Positive momentum like now tends to lead to further gains across all time horizons. And from two to twelve months later, the signal showed significance.
RSI readings above 76 are considered a strong indication of bull markets rather than bear markets. The last instance of the indicator surpassing 76 during a bear market dates back to 1969.
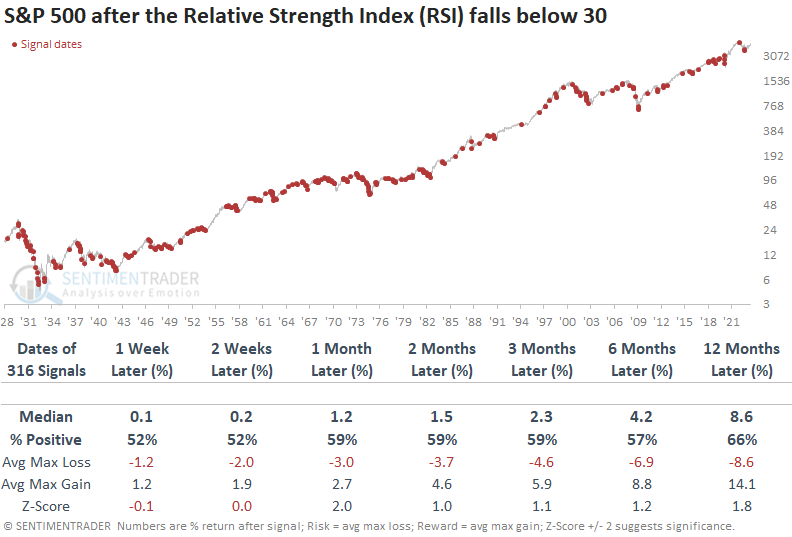
What happens when the RSI falls below an oversold reading of 30
Since 1928, there have been 317 instances when the Relative Strength Index has fallen below 30. While returns and win rates are positive, history shows oversold conditions are less favorable than overbought ones.
Negative price momentum tends to beget more negative price momentum.
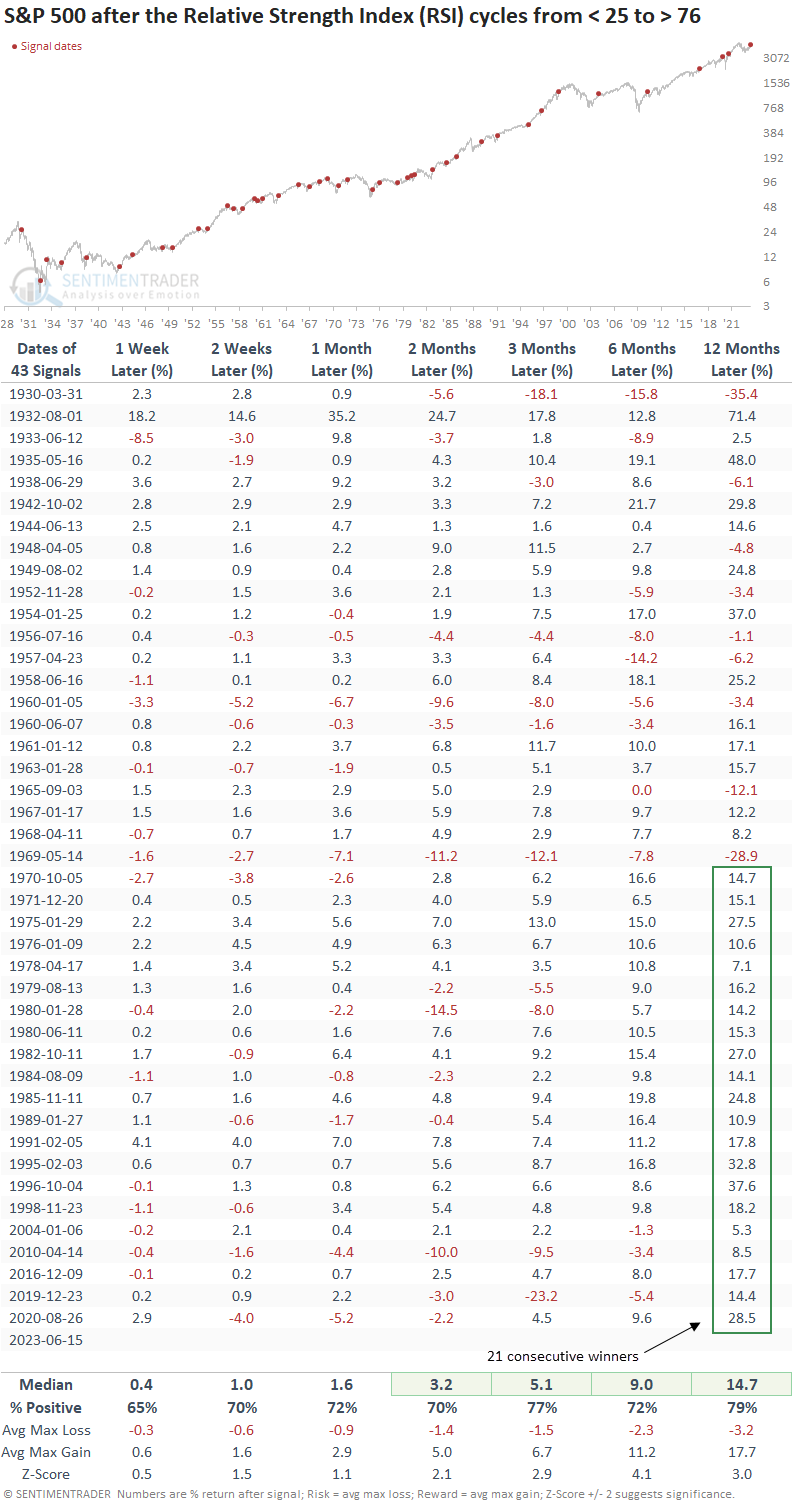
Additional context
Let's examine historical instances of the RSI surging above 76 following a decline below 25, similar to the present scenario.
Returns, win rates, and z-scores are better when the RSI for the S&P 500 cycles from below 25 to above 76, as compared to all instances when the indicator surpassed 76. Over the next two months, the signal shows a gain at some point in 40 out of 43 cases.
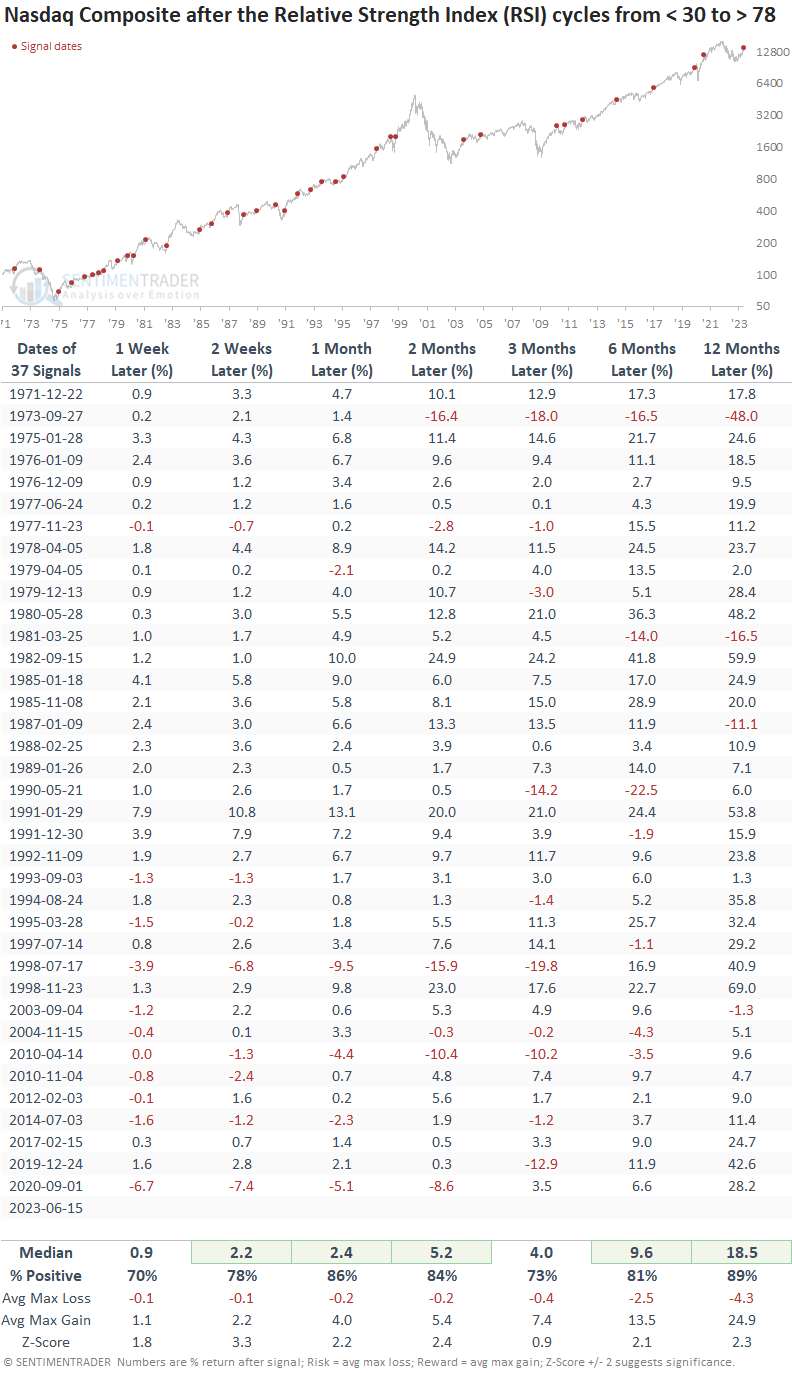
Nasdaq price momentum
Price momentum is surging in other indexes. The RSI for the Nasdaq Composite Index exceeded 78 on Thursday after falling below 30 in 2022.
Returns, win rates, and z-scores are excellent.
What the research tells us...
Price momentum for the S&P 500, as measured by the Relative Strength Index (RSI), is surging into a bullish overbought condition. Based on similar signals in the past, the upward momentum will likely persist over the next year, despite the expected consolidations and corrections along the way. The price action in the Nasdaq Composite is also impressive, with its RSI cycling from less than 30 to greater than 78. Similar precedents led to outstanding gains and win rates across all time horizons.