Products
SentimenTrader Trading Tools
‍
Backtest Engine
My Trading Toolkit
Correlation Analysis
Seasonality
Market Prediction
Indicators & Data API
‍
Proprietary Indicators & Charts
Market Data API
Strategies & Scanner
‍
50+ Trading Strategies
Smart Stock Scanner
Smart Option Scanner
Research Reports
‍
Research Solutions
Reports Library
Free Resources
Simple Backtest Calculator
Simple Seasonality Calculator
The Kelly Criterion Calculator
Sentiment Geo Map
Public Research Reports
Education
Sentiment Indicators
Technical Indicators
Pricing
Company
About
In the News
Testimonials
Client Success Stories
Contact
Log inLoginSign up
< BACK TO ALL REPORTS

The NYSE advance-decline ratio triggered a bullish signal

Dean Christians
2024-05-07
For only the 14th time since 1933, the NYSE advance-decline ratio exceeded a threshold of 3 to 1 for three consecutive trading sessions. Similar precedents in a long-term uptrend produced a 100% win rate for the S&P 500 over the subsequent three and six months.

Key points:

  • Over the prior three sessions, advancing issues on the NYSE have significantly outpaced declining issues
  • Similar advance-decline ratio skews preceded outstanding returns and win rates for the S&P 500
  • Cyclicals tended to outperform the S&P 500 and defensive groups across most horizons

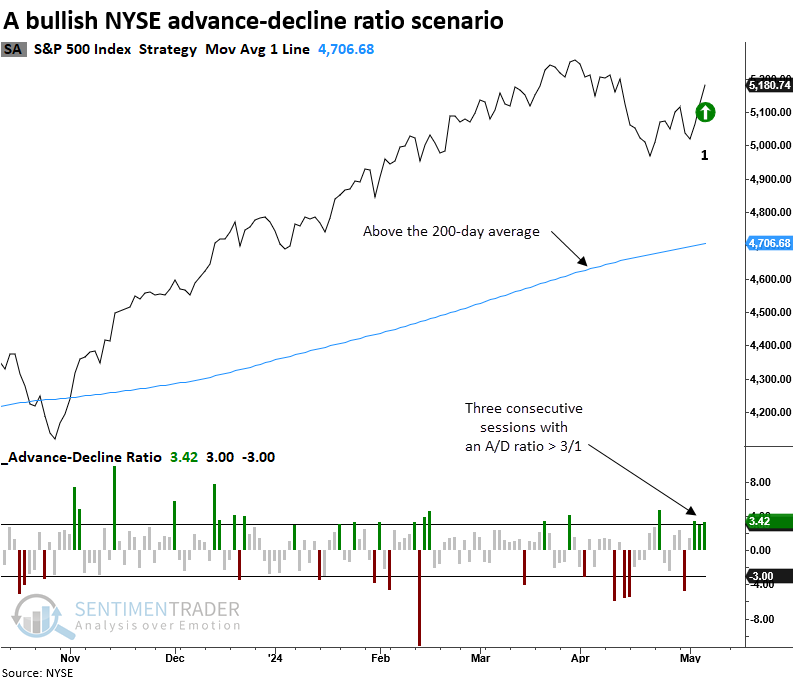
Advancing issues on the NYSE have outpaced declining issues by a wide margin

For only the 32nd time since 1931, the NYSE advance-decline ratio exceeded a threshold of 3 to 1 for three consecutive trading sessions. If I include a 200-day moving average filter to capture precedents that occurred with the S&P 500 above its long-term moving, like now, instances drop to 14, highlighting the rarity of this event.

The previous signal occurred in June 2016, leading to a robust rally.

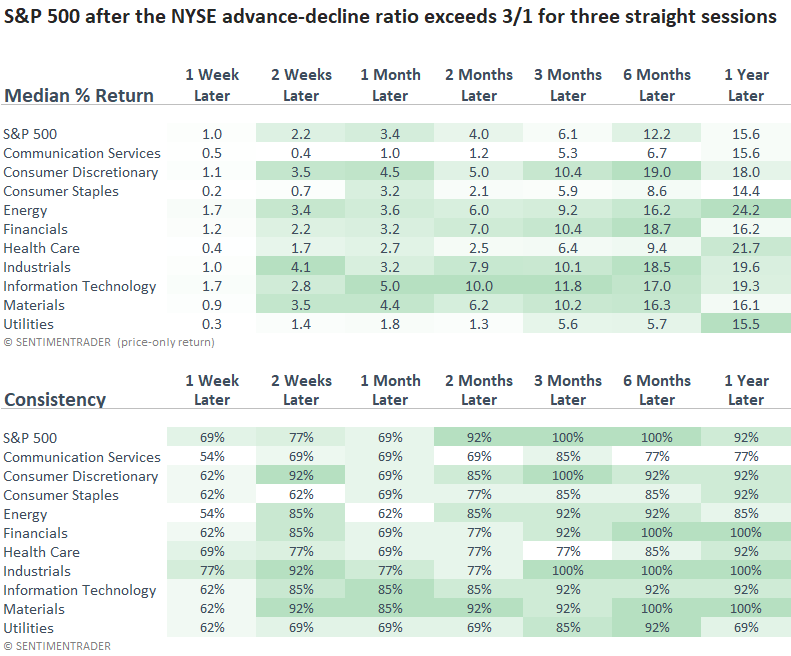
Similar A/D ratio conditions preceded an extremely favorable outlook for stocks

Following three successive instances where the NYSE advance-decline ratio exceeded 3 to 1, with the S&P 500 above its 200-day average, the world's most benchmarked index rallied 100% of the time over the subsequent three and six months.

A year later, the S&P 500 exhibited gains in 92% of occurrences, with the only loss being a 0.9% drop in 1933. 

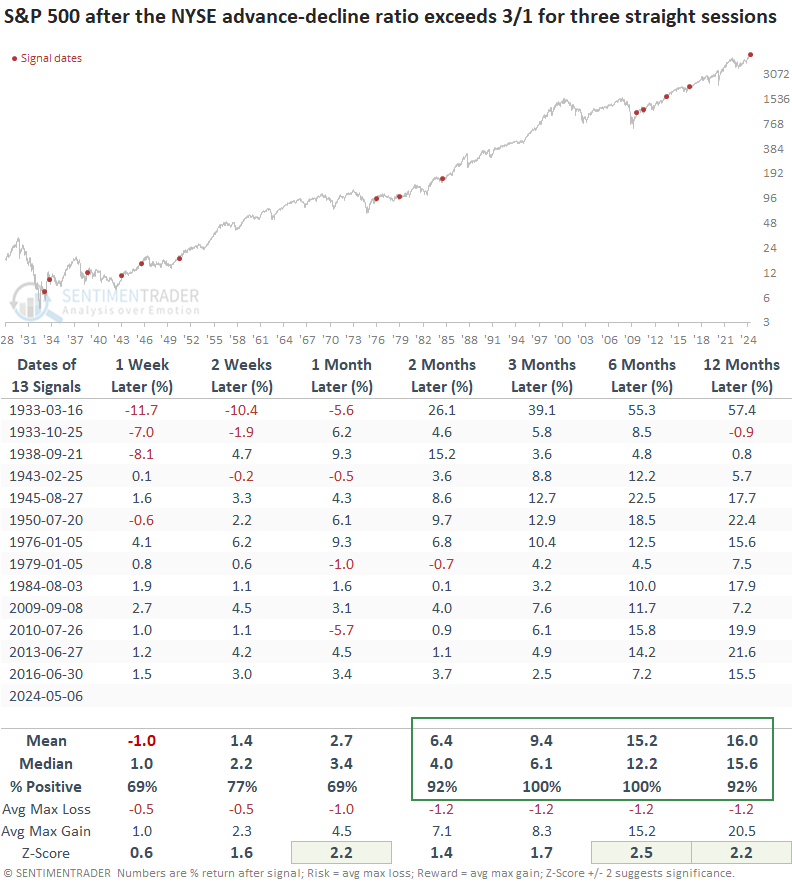
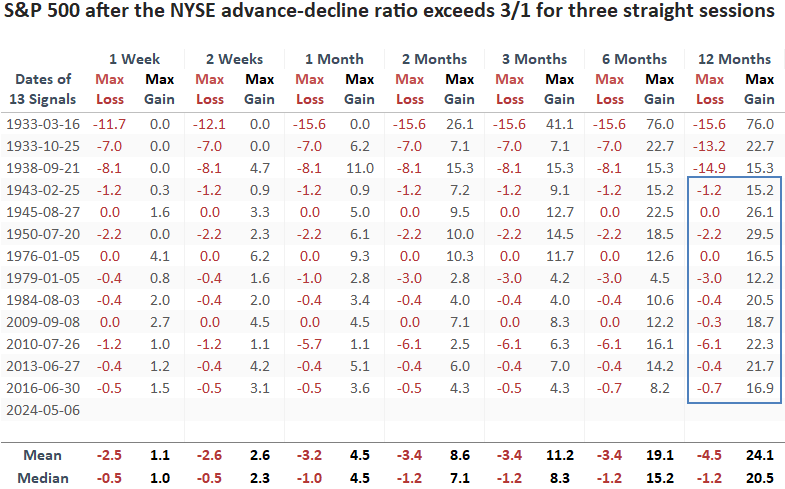
Since the 1929-42 secular bear market, there hasn't been a single instance of a maximum loss exceeding -10% over the subsequent year, a truly remarkable environment.

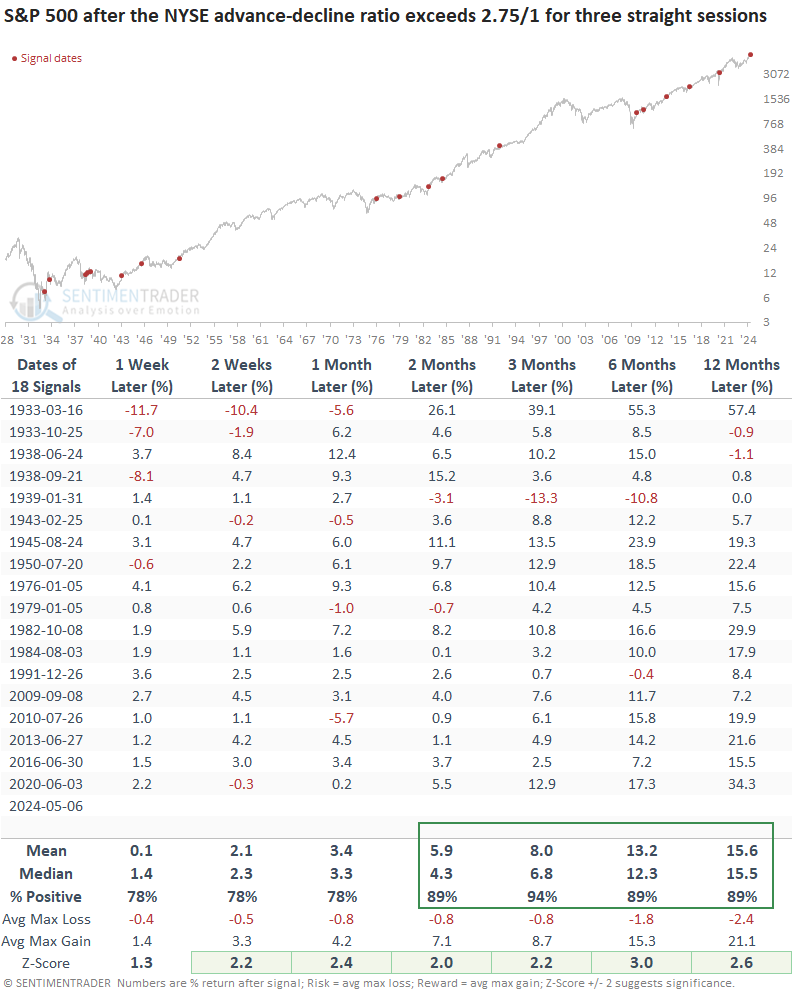
Suppose I lower the ratio threshold from 3/1 to 2.75/1 to increase the sample size. In that case, returns and win rates remained excellent, with 6 out of 7 horizons exhibiting significance relative to historical returns over the study period.

Unsurprisingly, cyclical-oriented sectors outperformed defensive groups across most time frames, with win rates exhibiting similar tendencies.

What the research tells us...

Following drawdowns ranging from 5% to 8%, which are typical corrections within a bull market, most indices are now working on reclaiming their upward trajectories. Favorable market breadth conditions bolster the case for a resumption of the uptrend. Over the last three sessions, advancing issues on the NYSE have outnumbered declining issues by a 3 to 1 ratio. Similar market breadth conditions produced outstanding results for the S&P 500, especially over medium and long-term horizons. Should history rhyme, investors who favored cyclical stocks over defensive ones enjoyed substantial rewards. 

PRODUCTS
SentimenTrader
Trading Tools
Indicators & Data API
‍
Strategies & Scanner
‍
Research Reports
FREE
RESOUrCES
Simple Backtest
Calculator
Simple Seasonality
Calculator
The Kelly Criterion
Calculator
Sentiment Geo Map
‍
Public Research Reports
‍
Education
Sentiment Indicators
‍
Technical Indicators
‍
Pricing
Bundle pricing
‍
FAQ
‍
Announcements
‍
COMPANY
‍
About
‍
In the News
‍
Testimonials
‍
Client Success Stories
CONTACT
‍
General Inquiries
‍
Media Inquiries
‍
Financial Professionals Inquiries
‍
© 2026 Sundial Capital Research Inc. All rights reserved.
Setsail Marketing
TermsPrivacyAffiliate Program
Risk Disclosure: The information and tools provided are for research and analytical purposes only and are not intended as investment advice. Market analysis involves uncertainty, and outcomes may differ from expectations. Users should conduct their own due diligence and consider their individual circumstances before making any financial decisions. Past performance is not necessarily indicative of future results.

Hypothetical Performance Disclosure: Hypothetical performance results have many inherent limitations, some of which are described below. No representation is being made that any account will or is likely to achieve profits or losses similar to those shown; in fact, there are frequently sharp differences between hypothetical performance results and the actual results subsequently achieved by any particular trading program. One of the limitations of hypothetical performance results is that they are generally prepared with the benefit of hindsight. In addition, hypothetical trading does not involve financial risk, and no hypothetical trading record can completely account for the impact of financial risk of actual trading. for example, the ability to withstand losses or to adhere to a particular trading program in spite of trading losses are material points which can also adversely affect actual trading results. There are numerous other factors related to the markets in general or to the implementation of any specific trading program which cannot be fully accounted for in the preparation of hypothetical performance results and all which can adversely affect trading results.

Testimonial Disclosure: Testimonials appearing on this website may not be representative of other clients or customers and is not a guarantee of future performance or success.