Data &
Technology
Research
Reports
Report Solutions
Reports Library
Actionable
Strategies
Free
Resources
Simple Backtest Calculator
Simple Seasonality Calculator
The Kelly Criterion Calculator
Sentiment Geo Map
Public Research Reports
Free Webinar
Pricing
Company
About
Meet Our Team
In the News
Testimonials
Client Success Stories
Contact
Log inLoginSign up
< BACK TO ALL REPORTS

The Most Important Index in the World Has Doubled - Now What?

Jason Goepfert
2021-07-14
The S&P 500 has doubled from its intraday low, the 9th time the index has doubled.

It seems like it's taken forever, but in reality, it was almost no time at all.

The most-benchmarked index in the world has now doubled from its pandemic low. After falling to 2,191 on March 23 of last year, the S&P 500 closed at 4,384 on Monday. This marks the third time that the index has doubled from a multi-year low over the past two decades.

S&P 500 doubles from low

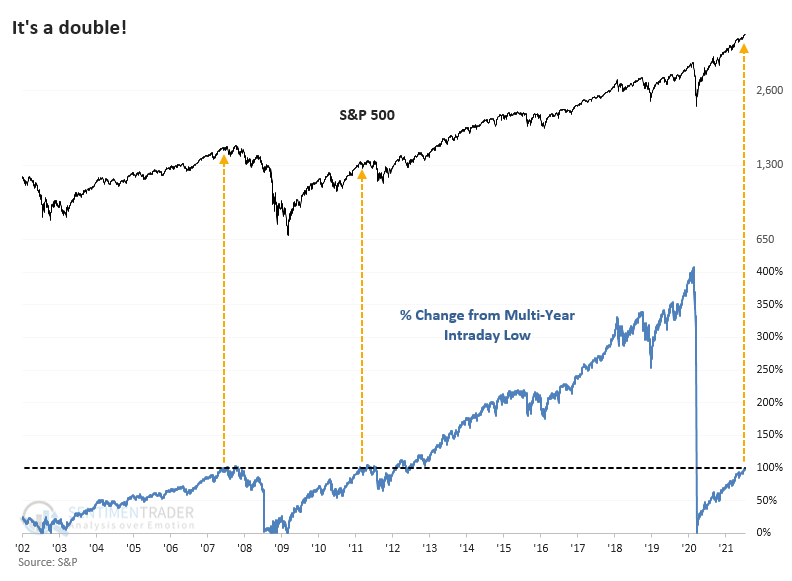
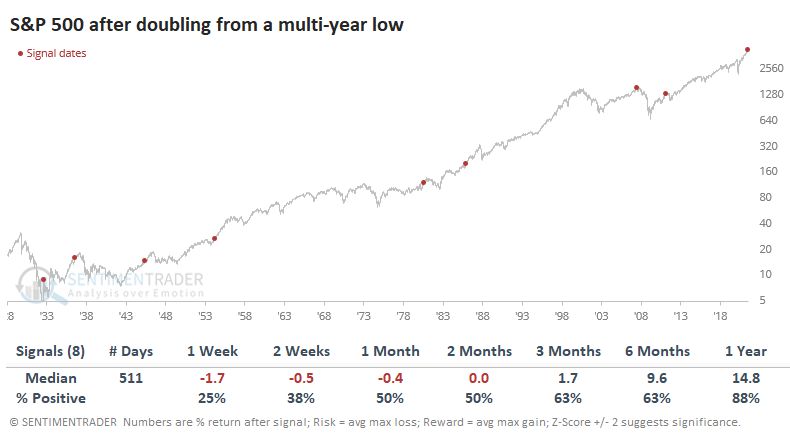
For what it's worth (maybe not much), the other two times the S&P reached its doubling point preceded a correction and a bear market. Going back to 1928, this is the 2nd-fastest doubling off of a multi-year low, eclipsed only by a breathtaking rally in 1932. These are the only two times it managed to double in under 400 trading sessions.

S&P doubles from low

It's doubtful whether investors pay much attention to this metric, so there's little reason why it should matter much to future returns. As we've seen time and again, however, trying to find a reason for moves is just an academic exercise, and often what seems to make sense doesn't work, anyway.

After the other doublings, the S&P continued to rally heartily in 1954 and 1985. The others either saw short- to medium-term pullbacks or had shorter-term gains erased as investors took a breather.


What else we're looking at

  • Full returns following a doubling in the S&P 500 from a multi-year low
  • What happens after a cluster of all-time highs in the S&P
  • The index has been hitting highs, but still fewer than 60% of stocks are above their 50-day moving averages
  • What gas prices mean for inflation
  • A look at a small-cap value vs. large-cap growth stock rotation switching system
  • There has been a surge in 4-week lows in Vietnamese stocks

Stat box

Earlier this week, there were 25 times more negative Tweets about the XLE energy fund than positive tweets. That's the largest difference in at least a decade.

Etcetera

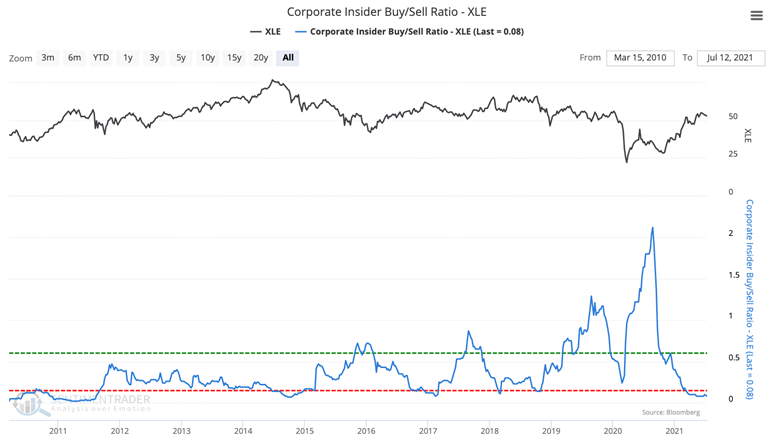
Out of energy. The ratio of corporate Insiders buying versus selling shares int their companies has sunk to 0.08, its lowest point in almost 7 years.

xle energy corporate insider buy sell

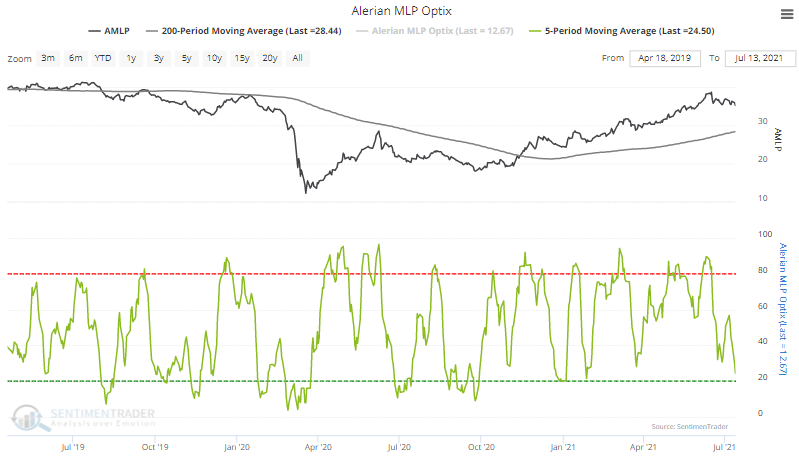
AMLPessimism. Over the past 5 sessions, the Optimism Index on the AMLP master limited partnership fund has dropped below 25 while the 200-day average of the fund shows an uptrend. Our Backtest Engine shows this has happened 10 other times, 8 of which preceded a rebound over the next month.

amlp sentiment

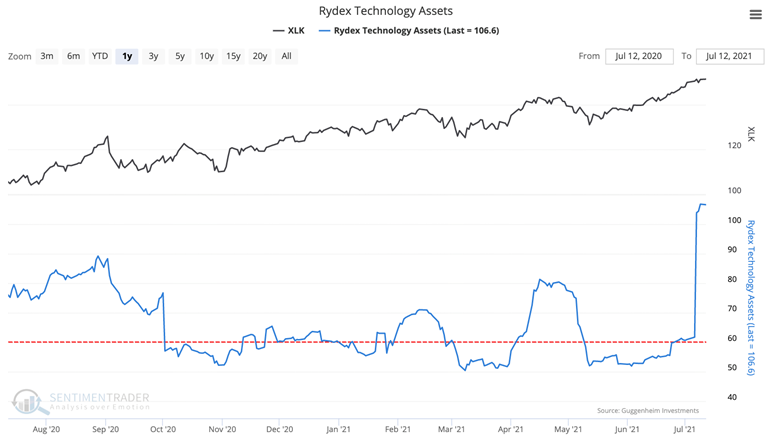
Tech boom. Rydex Technology Assets skyrocketed nearly $40 million last week. It looks to be the largest single-day jump since 2000 as mutual fund traders jump into what has been a hot sector.

rydex technology fund assets

DATA &
TECHnologies
IndicatorEdge
‍
BackTestEdge
‍
Other Tools
‍
DataEdge API
RESEARCH
reports
Research Solution
‍
Reports Library
‍
actionable
Strategies
Trading Strategies
‍
Smart Stock Scanner
‍
FREE
RESOUrCES
Simple Backtest
Calculator
Simple Seasonality
Calculator
The Kelly Criterion
Calculator
Sentiment Geo Map
‍
Public Research Reports
‍
Free Webinar
COMPANY
‍
About
‍
Meet our Team
‍
In the News
‍
Testimonials
‍
Client Success Stories
Pricing
Bundle pricing
‍
Announcements
‍
FAQ
© 2024 Sundial Capital Research Inc. All rights reserved.
Setsail Marketing
TermsPrivacyAffiliate Program
Risk Disclosure: Futures and forex trading contains substantial risk and is not for every investor. An investor could potentially lose all or more than the initial investment. Risk capital is money that can be lost without jeopardizing ones’ financial security or life style. Only risk capital should be used for trading and only those with sufficient risk capital should consider trading. Past performance is not necessarily indicative of future results.

Hypothetical Performance Disclosure: Hypothetical performance results have many inherent limitations, some of which are described below. No representation is being made that any account will or is likely to achieve profits or losses similar to those shown; in fact, there are frequently sharp differences between hypothetical performance results and the actual results subsequently achieved by any particular trading program. One of the limitations of hypothetical performance results is that they are generally prepared with the benefit of hindsight. In addition, hypothetical trading does not involve financial risk, and no hypothetical trading record can completely account for the impact of financial risk of actual trading. for example, the ability to withstand losses or to adhere to a particular trading program in spite of trading losses are material points which can also adversely affect actual trading results. There are numerous other factors related to the markets in general or to the implementation of any specific trading program which cannot be fully accounted for in the preparation of hypothetical performance results and all which can adversely affect trading results.

Testimonial Disclosure: Testimonials appearing on this website may not be representative of other clients or customers and is not a guarantee of future performance or success.