Data &
Technology
Research
Reports
Report Solutions
Reports Library
Actionable
Strategies
Free
Resources
Simple Backtest Calculator
Simple Seasonality Calculator
The Kelly Criterion Calculator
Sentiment Geo Map
Public Research Reports
Free Webinar
Pricing
Company
About
Meet Our Team
In the News
Testimonials
Client Success Stories
Contact
Log inLoginSign up
< BACK TO ALL REPORTS

The meaning behind Tech's big swings

Jason Goepfert
2021-03-19
Despite some recent losses, Technology stocks have outperformed Industrials by 2% or more on 28 days over the past year.

There has been a lot of rotation going on in markets lately, between assets, indexes, and factors.

Mark Hulbert, writing in Barron's, noted the Nasdaq's sudden snapback versus the Dow Industrials the other day. Once again, the Nasdaq surged relative to the Dow, adding to the count of outsized moves in recent months.

We certainly saw that at the top of the dot-com bubble. Over the three months prior to that top, there were no fewer than 14 trading sessions in which the Nasdaq's alpha over the Dow was at least two percentage points. No other three-month period over the past 50 years has seen as many large positive alphas between the two indexes.

Going back further, we can look at the daily changes in the total return in Technology versus Industrial stocks. The chart below shows a running count of how many days there were in the past year when Tech outperformed Industrials by 2% or more. Even with some big relative losses in recent days, Tech has put in a large number of good performances over the past year.

Technology stocks outperform Industrials

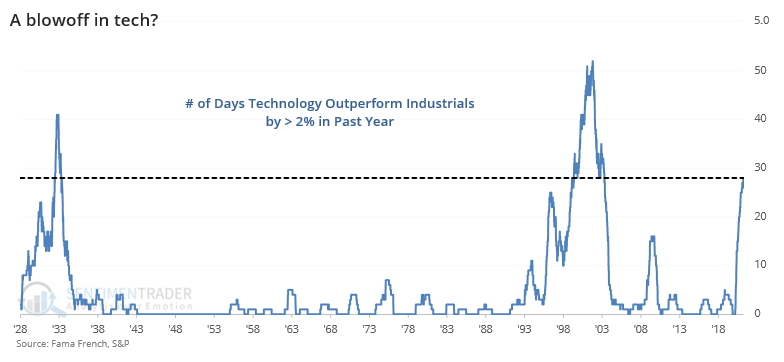
While it wasn't a good timing signal, the overriding message was clear, or at least as clear as it can be with a sample size of 2. Over the next 2-3 years, Technology greatly under-performed Industrials after the other instances.

What else we're looking at

  • Returns in the S&P 500, Technology, Industrials, and the ratio between them after other spikes in Tech outperformance
  • Updating a (very) long look at yields and inflation
  • VIX volatility futures have triggered a minor buy signal
  • What it means for sectors and assets when a "prices paid" survey spikes higher
  • Yes, bonds are oversold, but... 

Stat Box

For only the 13th time since 1950, there were no energy stocks above their 10-day moving average on Thursday while more than 95% of them held above their 200-day moving averages. This shows extreme short-term selling pressure in long-term uptrends. 


Etcetera

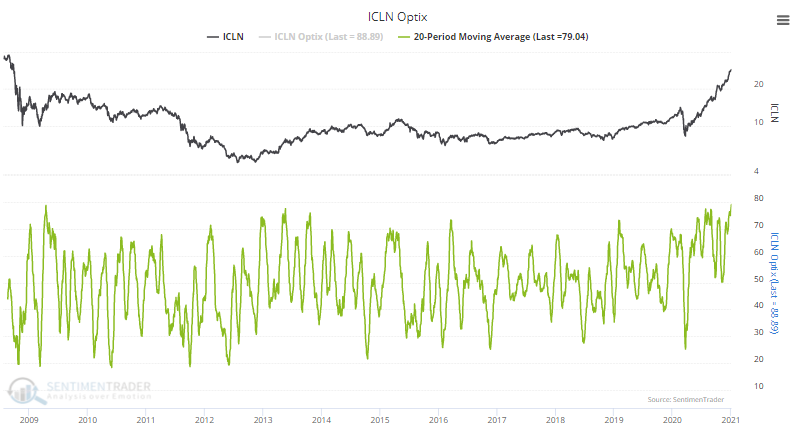
Clean...and optimistic. Investors in the iShares Global Clean Energy ETF, ICLN, are pricing in some good times. A 20-day moving average of the Optimism Index has just reached a new record high.

clean energy icln sentiment

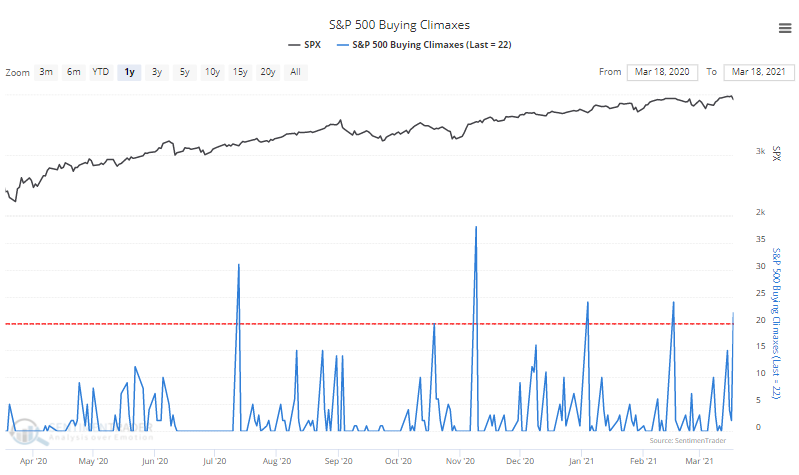
Reversal of fortunes. With a jump in stocks hitting new highs, and then falling back, the number of Buying Climaxes among stocks in the S&P 500 index has spiked to one of the highest levels in a year.

s&p 500 buying climaxes

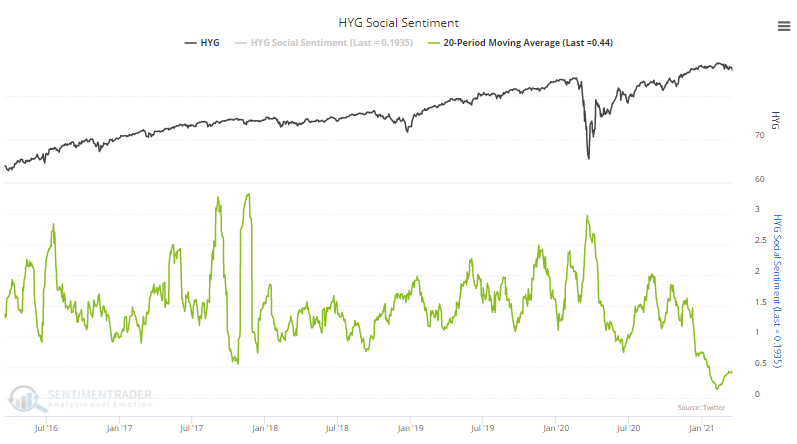
Too positive about junk? Twitter users have been tweeting unusually positive things about the most popular high-yield bond fund, HYG. Social Sentiment, which is calculated like a put/call ratio, has been at record lows over the past month. This means that our machine learning algorithm has determined that the vast majority of tweets have expressed positive sentiment about the fund.

high yield junk hyg twitter sentiment

DATA &
TECHnologies
IndicatorEdge
‍
BackTestEdge
‍
Other Tools
‍
DataEdge API
RESEARCH
reports
Research Solution
‍
Reports Library
‍
actionable
Strategies
Trading Strategies
‍
Smart Stock Scanner
‍
FREE
RESOUrCES
Simple Backtest
Calculator
Simple Seasonality
Calculator
The Kelly Criterion
Calculator
Sentiment Geo Map
‍
Public Research Reports
‍
Free Webinar
COMPANY
‍
About
‍
Meet our Team
‍
In the News
‍
Testimonials
‍
Client Success Stories
Pricing
Bundle pricing
‍
Announcements
‍
FAQ
© 2024 Sundial Capital Research Inc. All rights reserved.
Setsail Marketing
TermsPrivacyAffiliate Program
Risk Disclosure: Futures and forex trading contains substantial risk and is not for every investor. An investor could potentially lose all or more than the initial investment. Risk capital is money that can be lost without jeopardizing ones’ financial security or life style. Only risk capital should be used for trading and only those with sufficient risk capital should consider trading. Past performance is not necessarily indicative of future results.

Hypothetical Performance Disclosure: Hypothetical performance results have many inherent limitations, some of which are described below. No representation is being made that any account will or is likely to achieve profits or losses similar to those shown; in fact, there are frequently sharp differences between hypothetical performance results and the actual results subsequently achieved by any particular trading program. One of the limitations of hypothetical performance results is that they are generally prepared with the benefit of hindsight. In addition, hypothetical trading does not involve financial risk, and no hypothetical trading record can completely account for the impact of financial risk of actual trading. for example, the ability to withstand losses or to adhere to a particular trading program in spite of trading losses are material points which can also adversely affect actual trading results. There are numerous other factors related to the markets in general or to the implementation of any specific trading program which cannot be fully accounted for in the preparation of hypothetical performance results and all which can adversely affect trading results.

Testimonial Disclosure: Testimonials appearing on this website may not be representative of other clients or customers and is not a guarantee of future performance or success.