Data &
Technology
Research
Reports
Report Solutions
Reports Library
Actionable
Strategies
Free
Resources
Simple Backtest Calculator
Simple Seasonality Calculator
The Kelly Criterion Calculator
Sentiment Geo Map
Public Research Reports
Free Webinar
Pricing
Company
About
Meet Our Team
In the News
Testimonials
Client Success Stories
Contact
Log inLoginSign up
< BACK TO ALL REPORTS

The McClellan Summation Index for defensive sectors nears a record

Jason Goepfert
2022-01-10
The McClellan Summation Index for Consumer Staples, Utilities, and Health Care are all above +1000. The combined value in these defensive sectors is now in the top 1% of all days since 1952. Prior signals led to consistent gains in the S&P 500 over the next 6-12 months.

Key points:

  • The McClellan Summation Index for Staples, Utilities, and Health Care are all above +1000
  • This is one of the strongest combined readings in those defensive sectors in 70 years
  • Prior signals led to mostly higher stocks 6-12 months later

Impressive long-term internal recoveries in the most defensive sectors

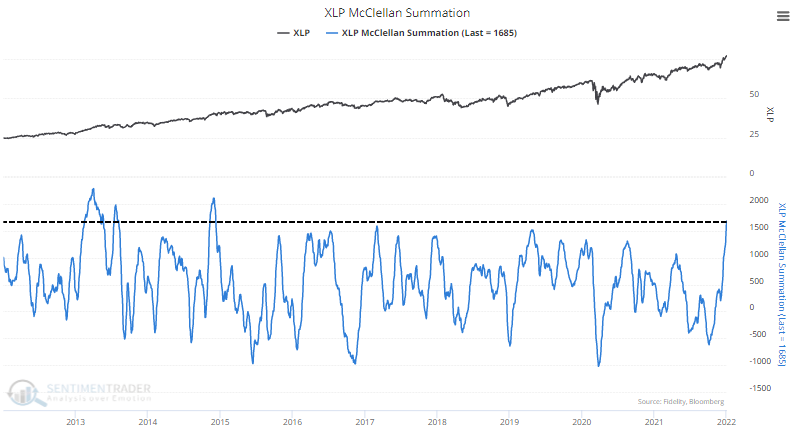
Consumer Staples stocks have been on a roll. In December, we saw that those stocks were seeing an impressive thrust and longer-term recovery, which has tended to see further gains in the months ahead.

So far, that's been the case. The McClellan Summation Index for Staples is now well above +1000, one of its highest readings in a decade.

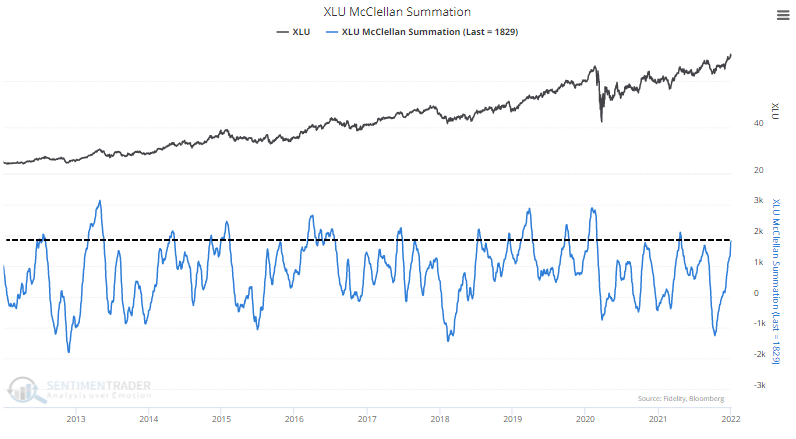
It's not just Staples. Another core defensive sector, Utilities, is also seeing impressive internal momentum.

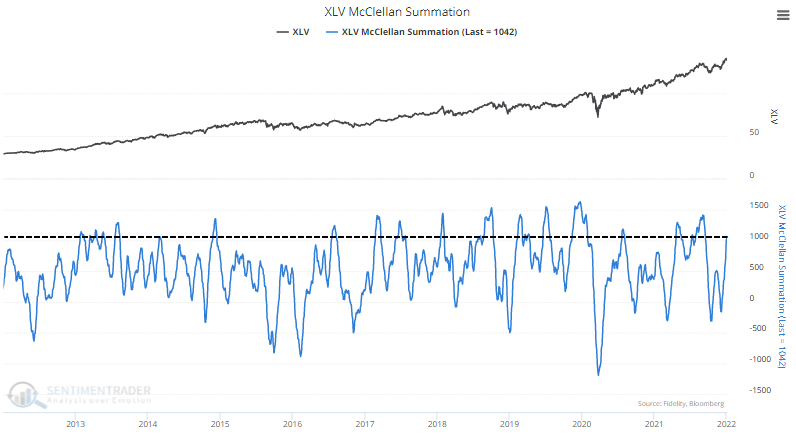
And so is the other one, Health Care.

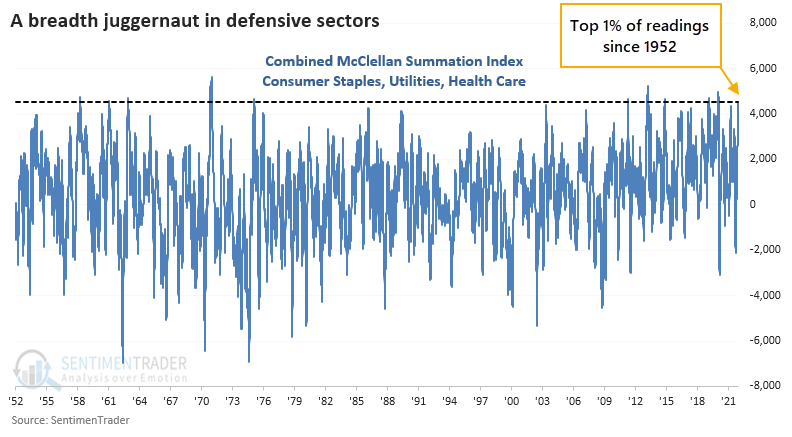
The Summation Index for all 3 sectors is now well above +1000, and their combined value is now in the top 1% of all days since 1952.

Not a sign of an impending bear market

It's assumed that if investors are so hyper-focused on defensive stocks, it's a bad omen for the broader market. Not to be. While the S&P 500 didn't exactly go gangbusters after these signs of long-term internal momentum in the defensive sectors, it still showed above-average returns. It was rare to see a loss over the next 6-12 months.

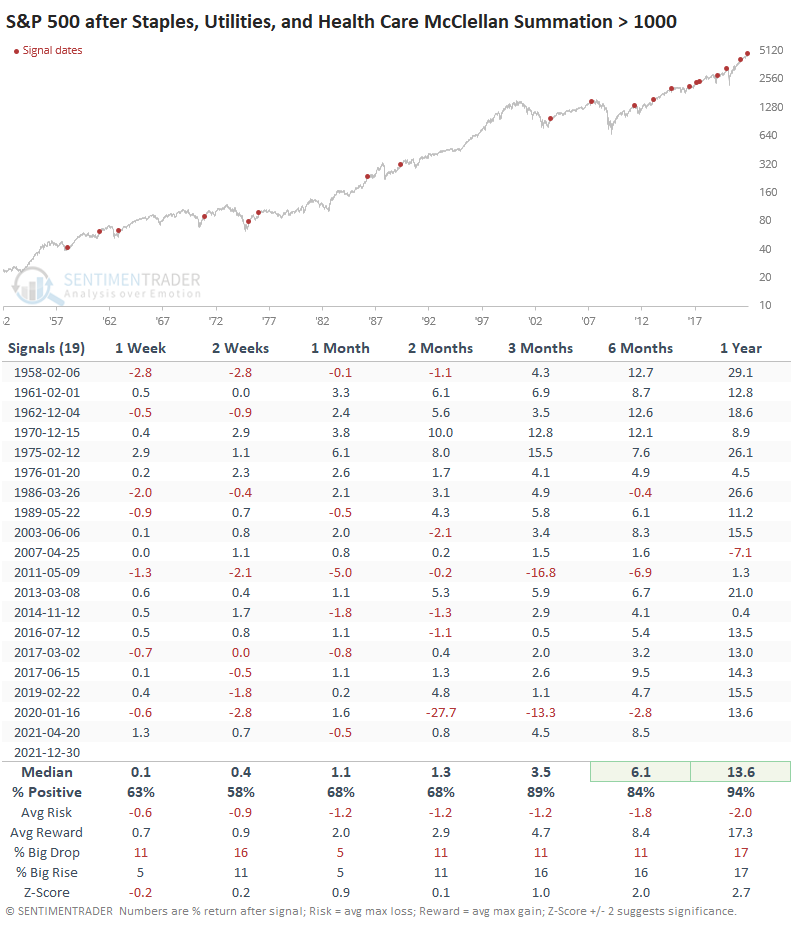
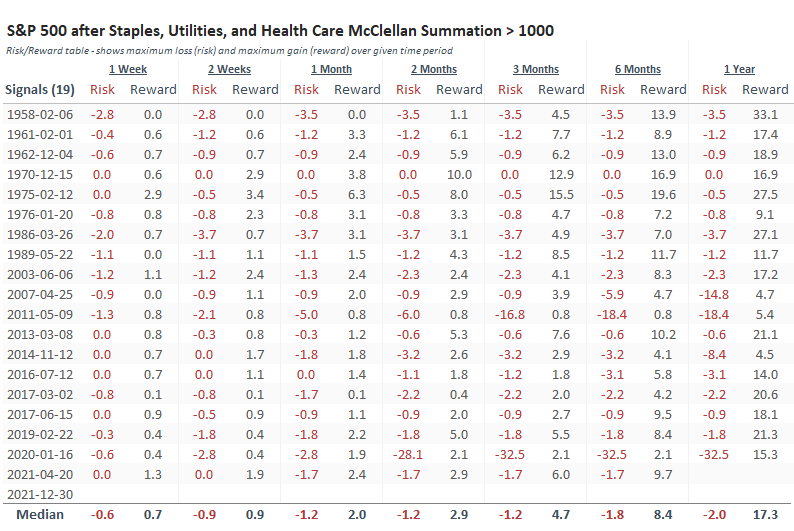
The Risk/Reward table shows small drawdowns with 2 exceptions (2011 and 2020). Outside of those two dates, the S&P didn't lose more than 6% at any point within the next 6 months. By comparison, 13 of the signals showed a gain of more than +6% at some point in the next 6 months.

A (mostly) good sign for the sectors, too

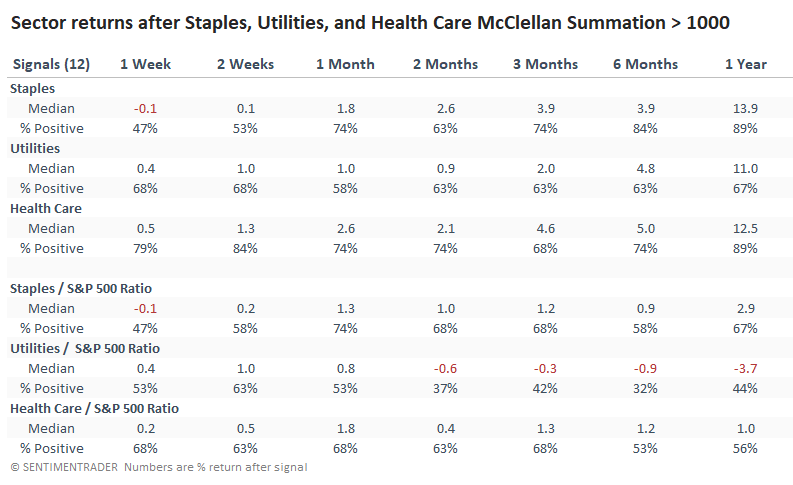
The most impressive performance for the sectors themselves was longer-term, except for Utilities. That sector always seems to have problems holding any kind of upside momentum extreme.

The table below shows each sector's return following the signals in the tables above, as well as their performance relative to the S&P 500.

There are some signs of overheating. Earlier this week, 100% of Staples stocks traded above their 50-day moving averages. The Backtest Engine shows that XLP showed a positive return over the next 2 months after only 3 out of 18 prior signals.

What the research tells us...

There have been thrusts across various time frames in the broad market, within the S&P 500, and even more so in some defensive sectors. While that could be taken as a negative sign of risk-off behavior for stocks in general, historically, that has not been the case. Strong and broad recoveries in Staples, Utilities, and Health Care, have preceded medium- to long-term gains in the S&P 500 with few exceptions. The signals were also good for the defensive sectors, though not for Utilities.

DATA &
TECHnologies
IndicatorEdge
‍
BackTestEdge
‍
Other Tools
‍
DataEdge API
RESEARCH
reports
Research Solution
‍
Reports Library
‍
actionable
Strategies
Trading Strategies
‍
Smart Stock Scanner
‍
FREE
RESOUrCES
Simple Backtest
Calculator
Simple Seasonality
Calculator
The Kelly Criterion
Calculator
Sentiment Geo Map
‍
Public Research Reports
‍
Free Webinar
COMPANY
‍
About
‍
Meet our Team
‍
In the News
‍
Testimonials
‍
Client Success Stories
Pricing
Bundle pricing
‍
Announcements
‍
FAQ
© 2024 Sundial Capital Research Inc. All rights reserved.
Setsail Marketing
TermsPrivacyAffiliate Program
Risk Disclosure: Futures and forex trading contains substantial risk and is not for every investor. An investor could potentially lose all or more than the initial investment. Risk capital is money that can be lost without jeopardizing ones’ financial security or life style. Only risk capital should be used for trading and only those with sufficient risk capital should consider trading. Past performance is not necessarily indicative of future results.

Hypothetical Performance Disclosure: Hypothetical performance results have many inherent limitations, some of which are described below. No representation is being made that any account will or is likely to achieve profits or losses similar to those shown; in fact, there are frequently sharp differences between hypothetical performance results and the actual results subsequently achieved by any particular trading program. One of the limitations of hypothetical performance results is that they are generally prepared with the benefit of hindsight. In addition, hypothetical trading does not involve financial risk, and no hypothetical trading record can completely account for the impact of financial risk of actual trading. for example, the ability to withstand losses or to adhere to a particular trading program in spite of trading losses are material points which can also adversely affect actual trading results. There are numerous other factors related to the markets in general or to the implementation of any specific trading program which cannot be fully accounted for in the preparation of hypothetical performance results and all which can adversely affect trading results.

Testimonial Disclosure: Testimonials appearing on this website may not be representative of other clients or customers and is not a guarantee of future performance or success.