
The Inflation 4% Solution

Inflation is very much on the minds of investors as government spending and debt, and deficits soar. Many are experiencing that gnawing feeling that they should "do something" to protect themselves. But is now the right time? And what about the old saw that stocks are a good hedge against inflation?
This piece will detail one simple approach to keeping inflation from acting as a detriment to your stock market performance.
HOW TO MEASURE INFLATION
The standard measure of inflation is the 12-month change in the Consumer Price Index (CPI). The Consumer Price Index (CPI) is:
- a measure that examines the weighted average of prices of a basket of consumer goods and services, such as transportation, food, and medical care
- used to assess price changes associated with the cost of living
- one of the most frequently used statistics for identifying periods of inflation or deflation.
WHEN TO MEASURE INFLATION
For testing purposes, at the end of each month, we will look at the latest reported 12-month rate of change in the Consumer Price Index.
HOW TO EVALUATE INFLATION
In generic terms, like Goldilocks, we want our inflation not too hot and not too cold.
- Soaring inflation throws cost estimates out the window and can cause massive economic disruption - something the market rarely takes kindly to
- Likewise, deflation - i.e., a trend of falling prices - can cause a downward economic spiral that is ugly for everyone
The question then is, "what is the right rate of inflation?" There is, of course, no such thing, partly because there are many other factors that affect the stock market beyond just inflation. Still, as far as deeming inflation "too high, too low or just right," we will use a straightforward method that can be referred to as "The 4% Inflation Solution."
THE 4% INFLATION SOLUTION
We will evaluate how the stock market has performed when inflation is:
- greater than or equal to +4%
- less than or equal to -4% (i.e., significant deflation)
- greater than -4% but less than +4%
For our test, we will use monthly data from February 1914 through February 28 to determine:
- The latest 12-month rate-of-change in the Consumer Price Index
- The monthly closing price for the Dow Jones Industrial Average
DOW PERFORMANCE WHEN INFLATION >= +4%
The chart below displays the cumulative price performance for the Dow ONLY during those times when inflation was >= +4%.
- The result is a net price decline of -16%
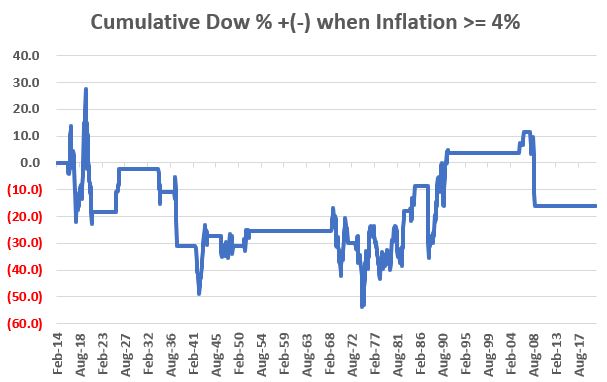
These results call into question the "stocks as a hedge against inflation" argument. On a buy-and-hold basis, yes, stocks have outperformed inflation. But as you see in the chart above, during actual bouts of serious inflation, the stock market has been very much of a mixed bag - with extremely volatile and net negative returns.
DOW PERFORMANCE WHEN INFLATION <= (-4%)
The chart below displays the cumulative price performance for the Dow during those times when inflation was <= -4%, i.e., during periods of serious deflation.
- The result is a net price decline of -42.7%
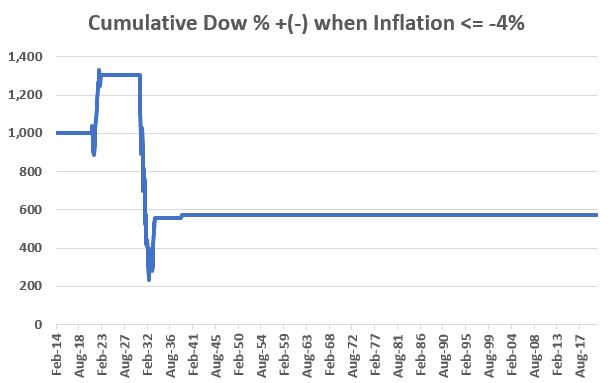
As you can see, the results were disastrous, albeit limited to two periods - one in the early 1920s and another in the early 1930s. Would the stock market react the same way if we plunged again into a deflationary spiral? Here's hoping we never find out.
DOW PERFORMANCE WHEN INFLATION < +4% AND > (-4%)
The chart below displays the cumulative price performance for the Dow during those times when inflation is in the "Not too hot, not too cold" range of above -4% but below +4%.
- The result is a net price gain of +61,027%
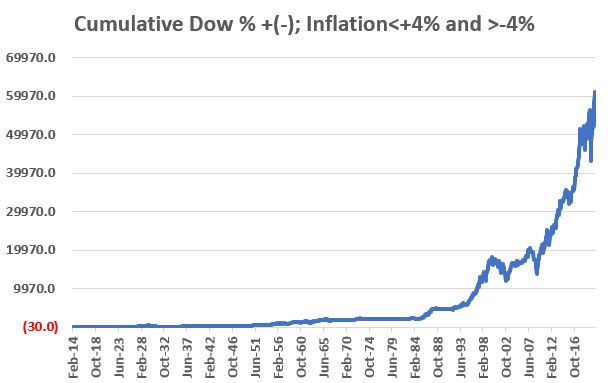
As you can see in the chart above, just because inflation is not running too hot or too cold does not mean that you can't have bear markets. Inflation is only one factor that can impact the stock market.
But clearly, the market appears to perform much better overall when inflation is under control.
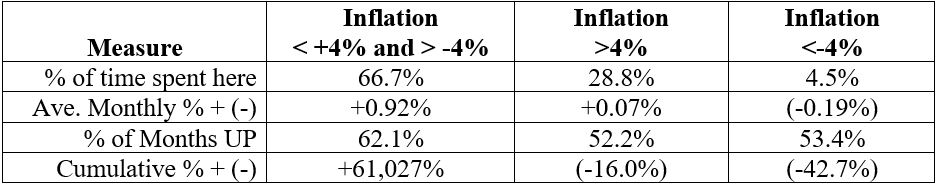
COMPARATIVE RESULTS
The table below puts a few facts and figures to the performance of the Dow during the different periods displayed in the charts above.
PUTTING THE INFLATION 4% SOLUTION INTO ACTION
To tie everything together, we will designate the stock market environment as "Favorable" or "Unfavorable" as follows:
- Favorable = If inflation is below +4% AND above -4%
- Unfavorable = If inflation is +4% or higher OR above -4% or lower
The chart below displays the cumulative price performance for the Dow when the inflation environment is deemed "Unfavorable."
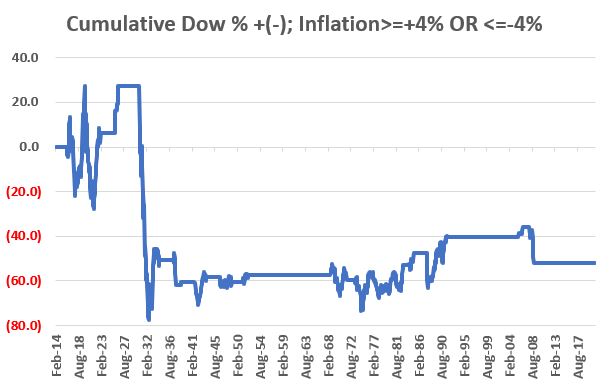
The table below compares Dow Jones Industrial Average price performance during Favorable versus Unfavorable periods.
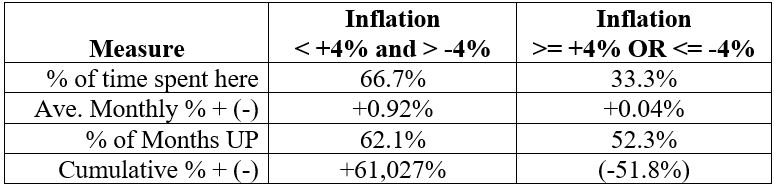
SUMMARY
The results above illustrate why stock investors fear high inflation (and/or deflation). That being said - and despite all of the fear and loathing regarding inflation that seems to be prevalent of late - until the latest 12-month rate of change for the Consumer Price Index exceeds +4% or -4%, stock investors should not be making portfolio changes based solely on inflationary fears.