Products
SentimenTrader Trading Tools
‍
Backtest Engine
My Trading Toolkit
Correlation Analysis
Seasonality
Market Prediction
Indicators & Data API
‍
Proprietary Indicators & Charts
Market Data API
Strategies & Scanner
‍
50+ Trading Strategies
Smart Stock Scanner
Smart Option Scanner
Research Reports
‍
Research Solutions
Reports Library
Free Resources
Simple Backtest Calculator
Simple Seasonality Calculator
The Kelly Criterion Calculator
Sentiment Geo Map
Public Research Reports
Education
Sentiment Indicators
Technical Indicators
Pricing
Company
About
In the News
Testimonials
Client Success Stories
Contact
Log inLoginSign up
< BACK TO ALL REPORTS

The fear gauge suggests stocks will rally in September

Dean Christians
2023-08-31
The Volatility Index (VIX) closed below 14 in August, suggesting stocks could rally in September, departing from the typically lackluster seasonal trends. After similar signals, the S&P 500 rallied 86% of the time over the subsequent month.

Key points:

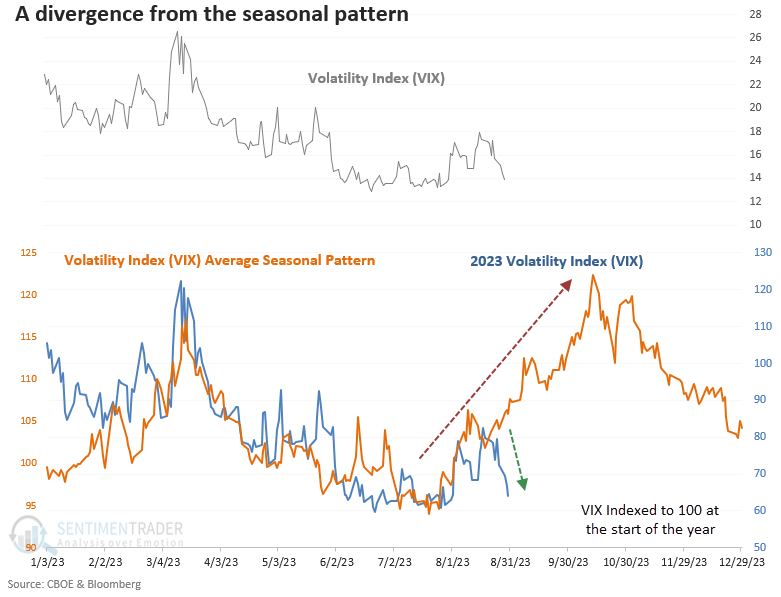
  • The Volatility Index (VIX) diverged from its seasonal pattern and closed below 14 in August
  • Similar contractions in volatility resulted in an 89% win rate for the S&P 500 over the next month
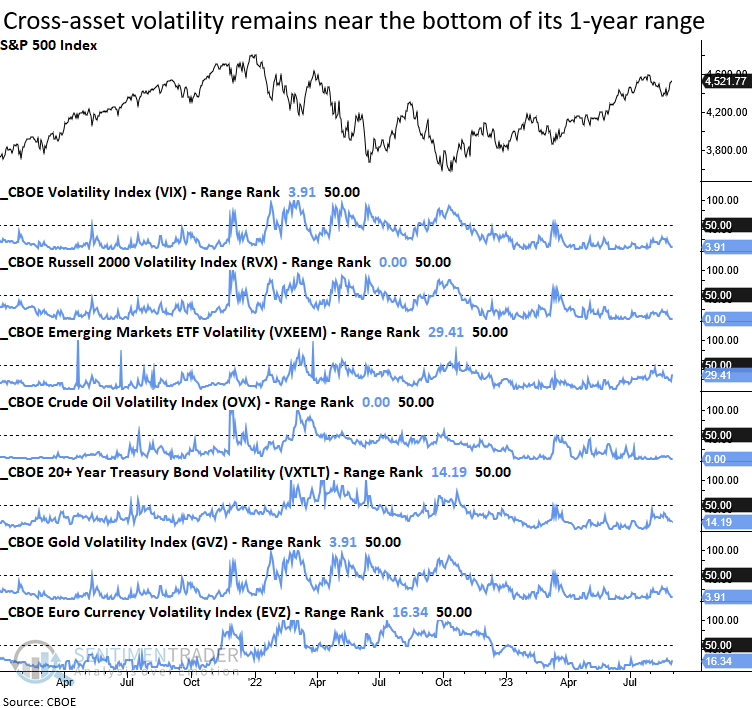
  • Cross-asset volatility continues to hover near the low end of its annual range

The Volatility Index (VIX) flashes a buy signal for stocks

In a research note in June, Jason shed light on the annual seasonal pattern for the Volatility Index (VIX), underscoring how the fear gauge tends to bottom in July and rise into October.

While the VIX bottomed near the annual seasonal low since 1990 and rose in unison with historical trends, its trajectory took a notable turn in recent weeks, plummeting below 14 on Wednesday. 

Let's assess the outlook for the S&P 500 when the Volatility Index (VIX) falls below 14 in August. 

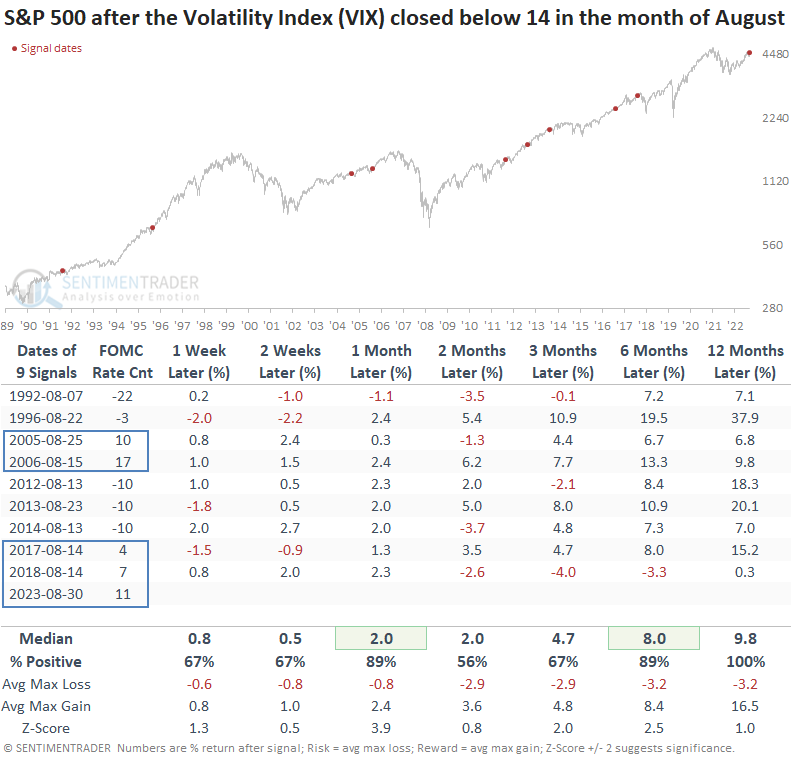
Similar volatility readings in August led to excellent returns for the S&P 500

When the Volatility Index (VIX) crossed below 14 in August, the S&P 500 rallied 89% of the time over the subsequent one and six-month periods. A year later, the large-cap index was higher every time despite several precedents that coincided with FOMC tightening cycles.

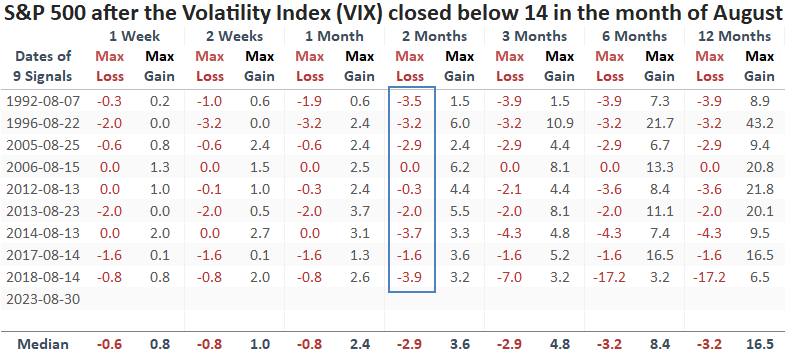
Over the next two months, the max loss never exceeded -4%. The August 2018 precedent is the only time a signal occurred ahead of a significant decline. Still, the S&P 500 gained 3.2% before peaking.

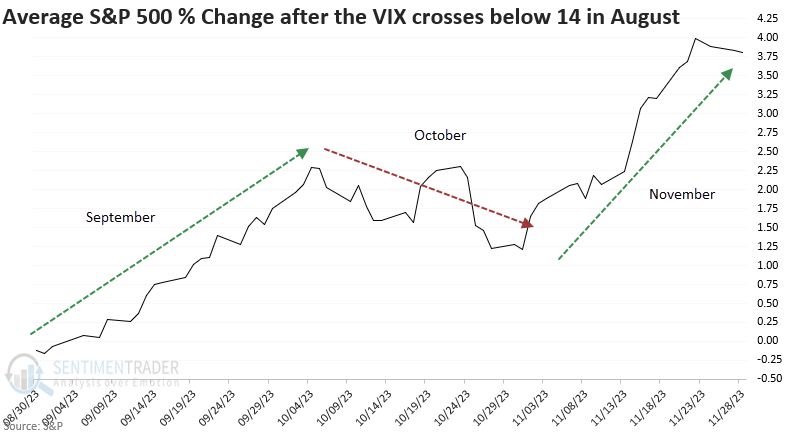
A potential year-end path for the S&P 500

When the Volatility Index falls below 14 in August, the S&P 500 tends to rally in September, consolidate/correct in October, and rally again in November. So, the traditional seasonality trends for stocks might play out differently than expected.

What about other asset classes

The fear gauge for various asset classes continues to hover near the lower end of their respective 1-year ranges, denoting a bullish backdrop for risk assets like stocks.

What the research tells us...

The Volatility Index (VIX) closed below 14 in August, triggering a bullish development for stocks. After similar signals, the S&P 500 was higher 86% of the time a month later, suggesting investors should not be cautious during the weakest month of the year, September. Should stocks rally in September, a consolidation/correction in October should set up a year-end rally.

PRODUCTS
SentimenTrader
Trading Tools
Indicators & Data API
‍
Strategies & Scanner
‍
Research Reports
FREE
RESOUrCES
Simple Backtest
Calculator
Simple Seasonality
Calculator
The Kelly Criterion
Calculator
Sentiment Geo Map
‍
Public Research Reports
‍
Education
Sentiment Indicators
‍
Technical Indicators
‍
Pricing
Bundle pricing
‍
FAQ
‍
Announcements
‍
COMPANY
‍
About
‍
In the News
‍
Testimonials
‍
Client Success Stories
CONTACT
‍
General Inquiries
‍
Media Inquiries
‍
Financial Professionals Inquiries
‍
© 2026 Sundial Capital Research Inc. All rights reserved.
Setsail Marketing
TermsPrivacyAffiliate Program
Risk Disclosure: The information and tools provided are for research and analytical purposes only and are not intended as investment advice. Market analysis involves uncertainty, and outcomes may differ from expectations. Users should conduct their own due diligence and consider their individual circumstances before making any financial decisions. Past performance is not necessarily indicative of future results.

Hypothetical Performance Disclosure: Hypothetical performance results have many inherent limitations, some of which are described below. No representation is being made that any account will or is likely to achieve profits or losses similar to those shown; in fact, there are frequently sharp differences between hypothetical performance results and the actual results subsequently achieved by any particular trading program. One of the limitations of hypothetical performance results is that they are generally prepared with the benefit of hindsight. In addition, hypothetical trading does not involve financial risk, and no hypothetical trading record can completely account for the impact of financial risk of actual trading. for example, the ability to withstand losses or to adhere to a particular trading program in spite of trading losses are material points which can also adversely affect actual trading results. There are numerous other factors related to the markets in general or to the implementation of any specific trading program which cannot be fully accounted for in the preparation of hypothetical performance results and all which can adversely affect trading results.

Testimonial Disclosure: Testimonials appearing on this website may not be representative of other clients or customers and is not a guarantee of future performance or success.