
The Copper/Gold Ratio and what it means for the financial markets

Key points
- The Copper/Gold Ratio just jumped. Does it matter?
- It is hard to assign a given asset's price movement to a single indicator
- Still, for some markets, specific actions in the Copper/Gold Ratio seem to matter a lot
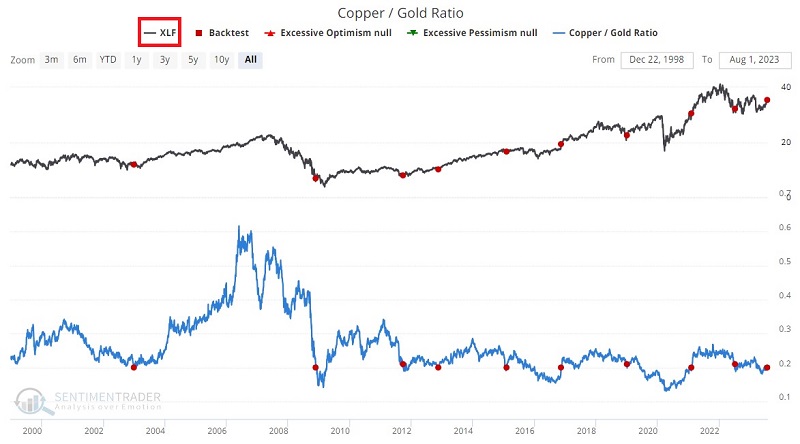
The Copper/Gold Ratio
Jeffrey Gundlach, CEO of DoubleLine Capital LP, has popularized the Copper / Gold Ratio. Note: Our calculation uses Copper and Gold Continuous Futures contracts. As the name implies, the calculation divides the price of copper by the price of gold. It shows the relationship between a critical industrial metal and the most widely followed precious metal.
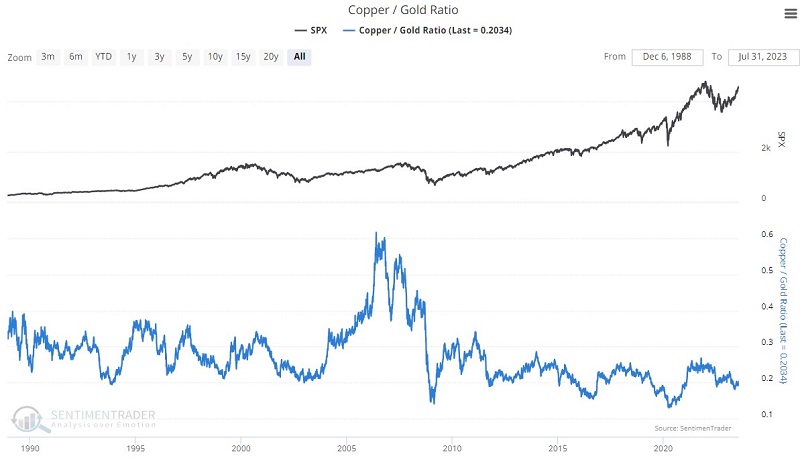
Can we point to a specific cause and effect regarding the Copper/Gold Ratio crossing a particular level and causing a specific movement in asset prices? Not really. Nevertheless, as it turns out, particular changes in and/or crosses above or below certain levels seem to trigger consistent reactions across the financial spectrum.
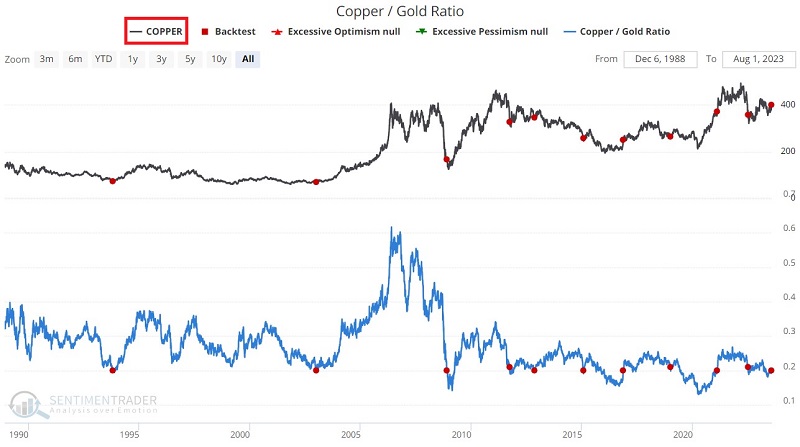
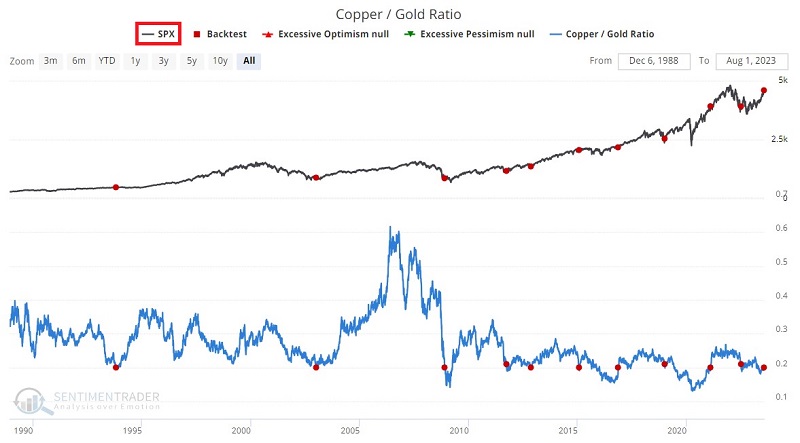
For our test, we will look at those times when the Copper/Gold Ratio crossed above 0.202 for the first time in 12 months, as it did on 2023-07-31.
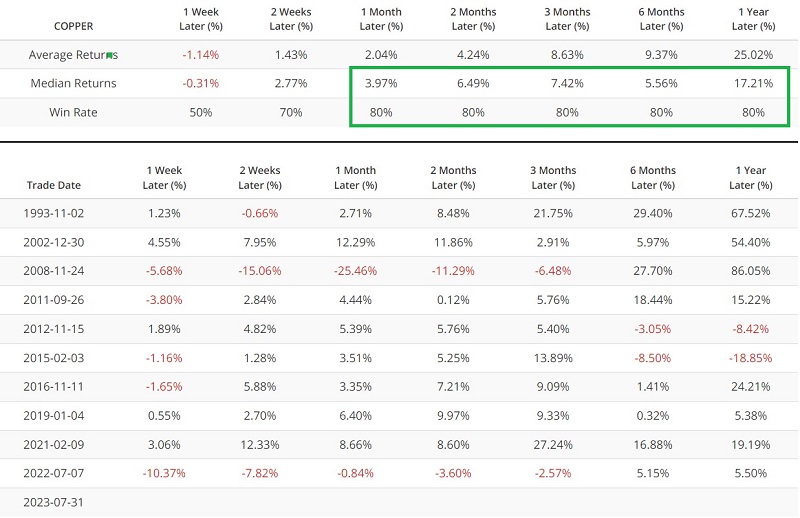
Copper
The chart and table below display Copper futures performance following the abovementioned signal.
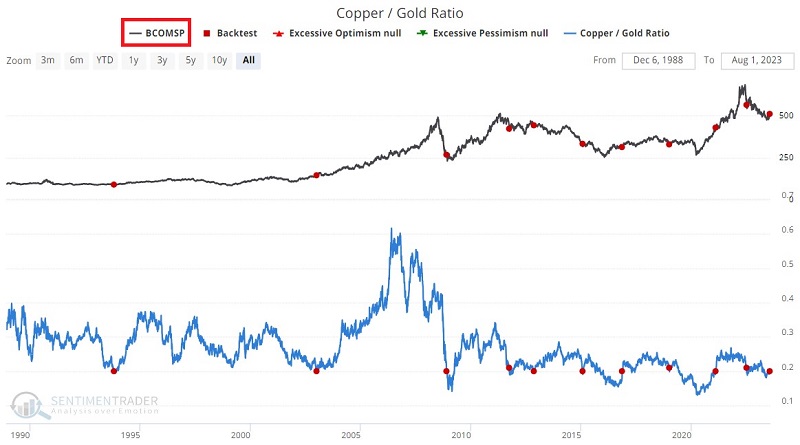
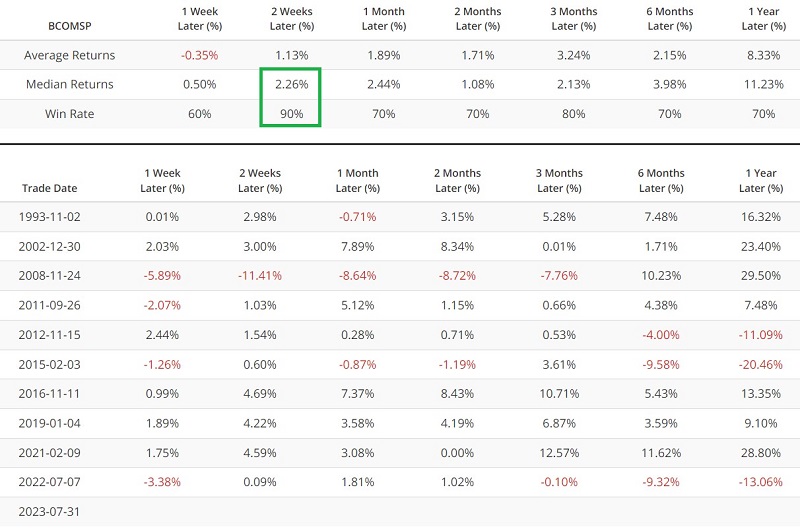
Commodities
The chart and table below display Bloomberg Commodity Spot Price Index performance following the abovementioned signal.
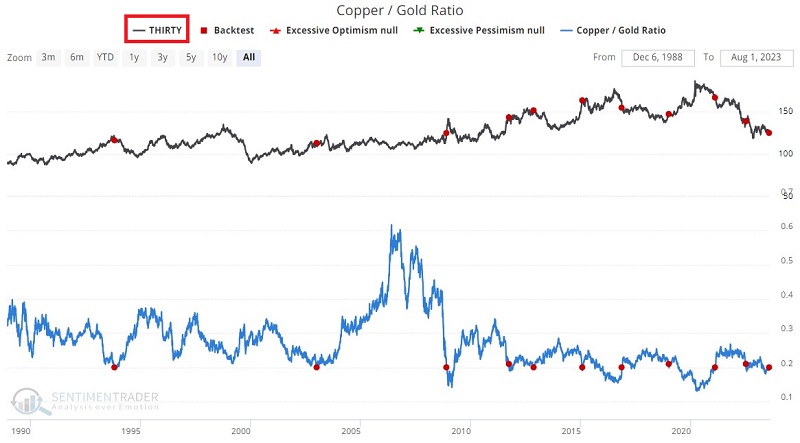
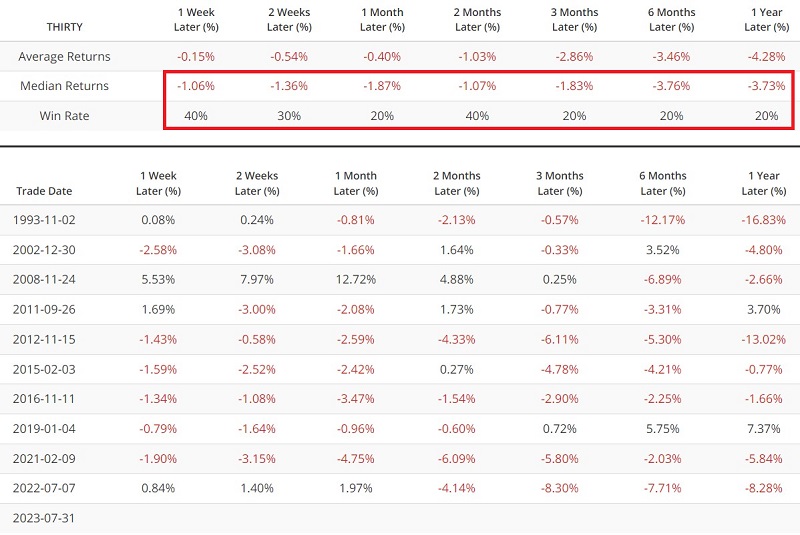
30-year T-Bonds
The chart and table below display 30-year treasury bond futures performance following the abovementioned signal.
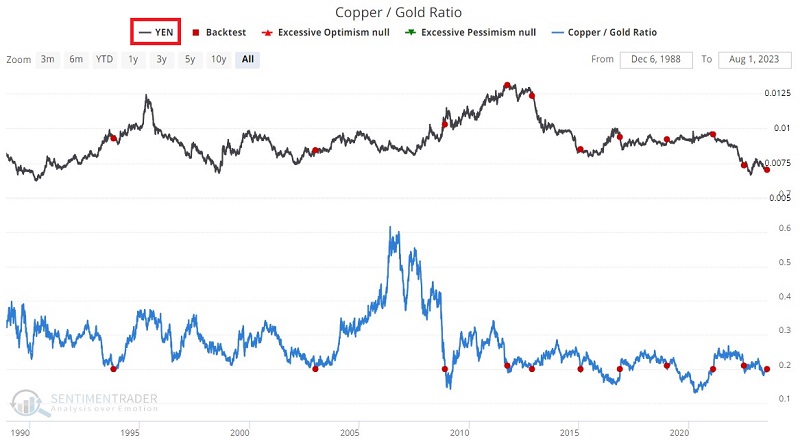
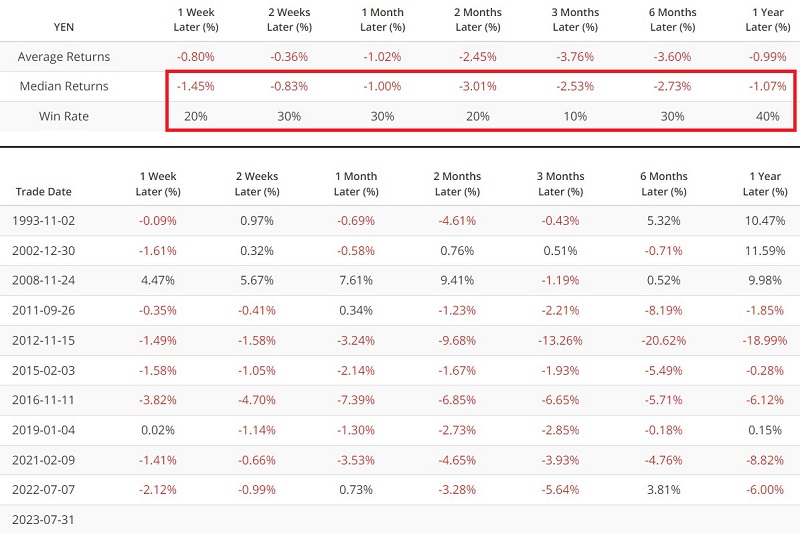
Japanese Yen
The chart and table below display Japanese Yen futures performance following the abovementioned signal.
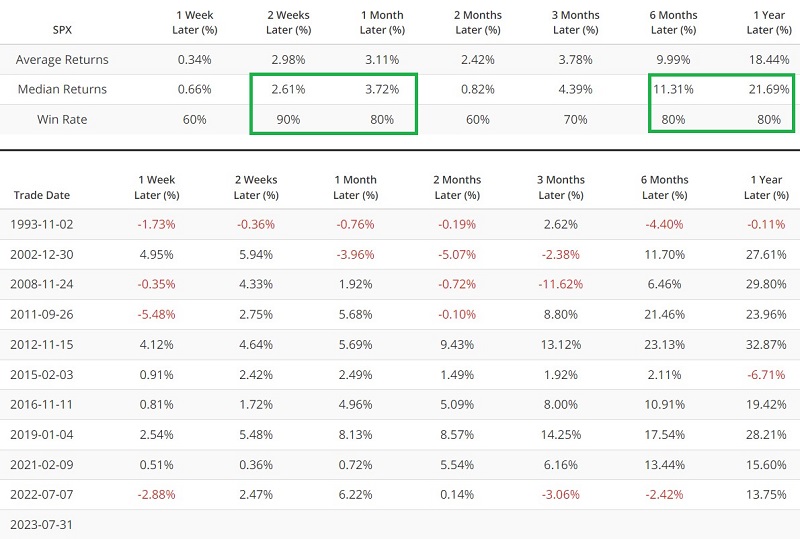
S&P 500 Index
The chart and table below display S&P 500 Index performance following the abovementioned signal.
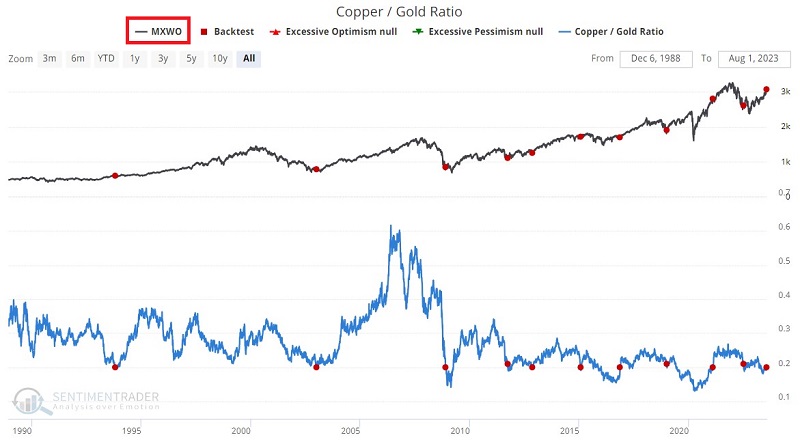
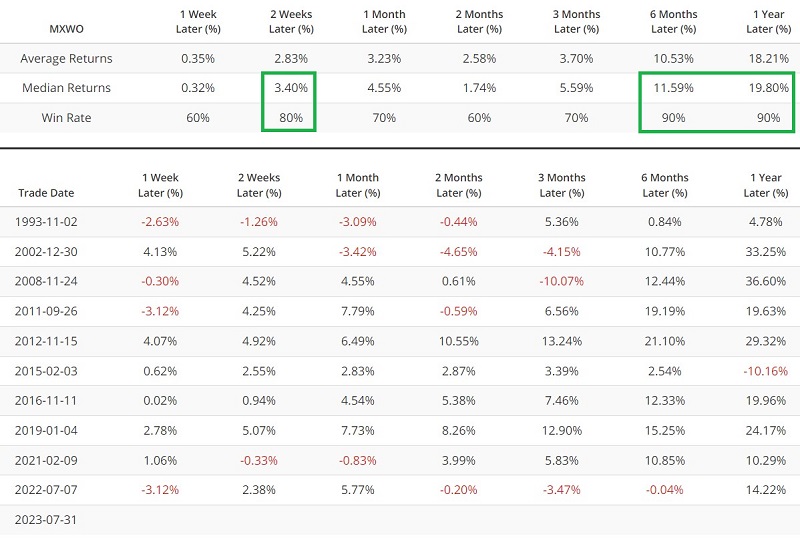
MSCI ACWI All-World Index
The chart and table below display the MSCI ACWI All-World Index performance following the abovementioned signal.
Now let's focus on some interesting sector performance highlights.
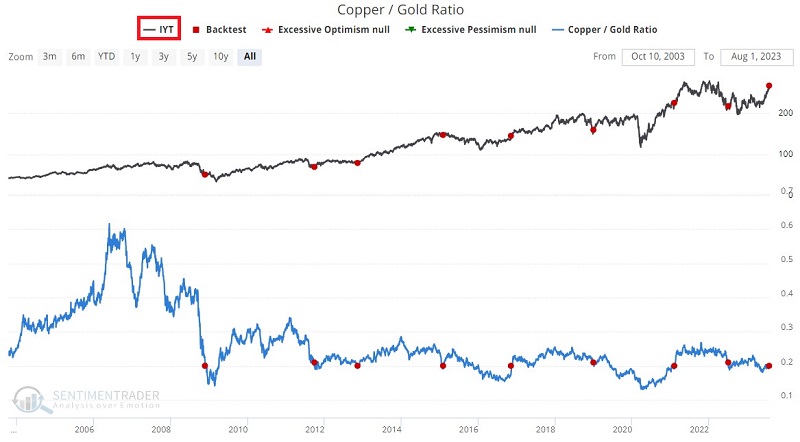
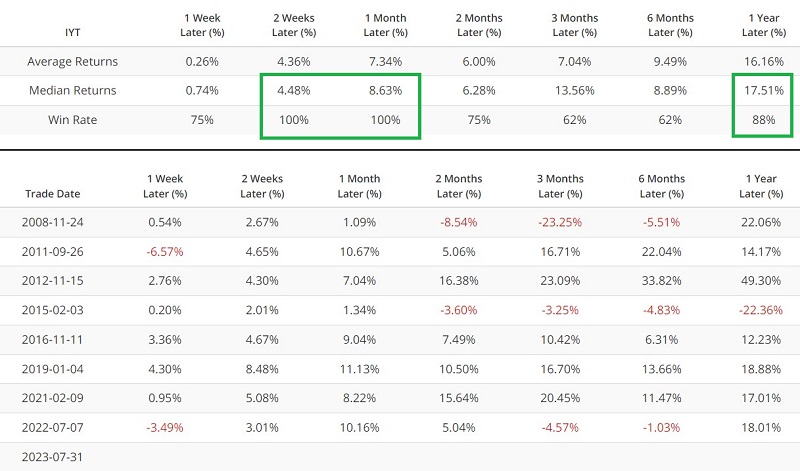
Transportation sector (IYT)
The chart and table below display iShares Transportation Average ETF (IYT) performance following the abovementioned signal.
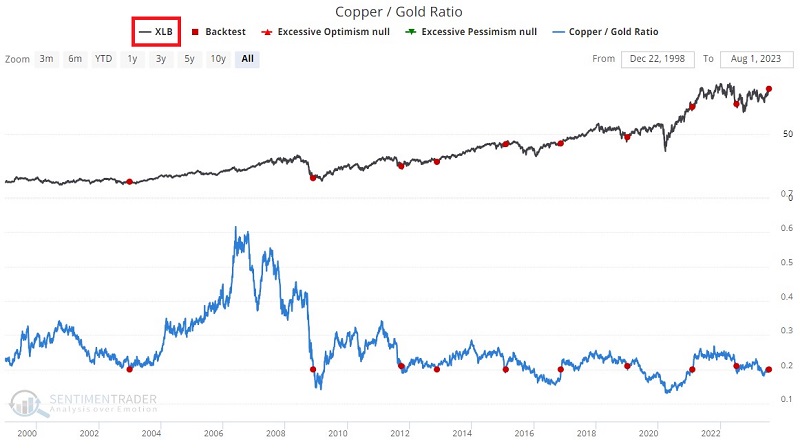
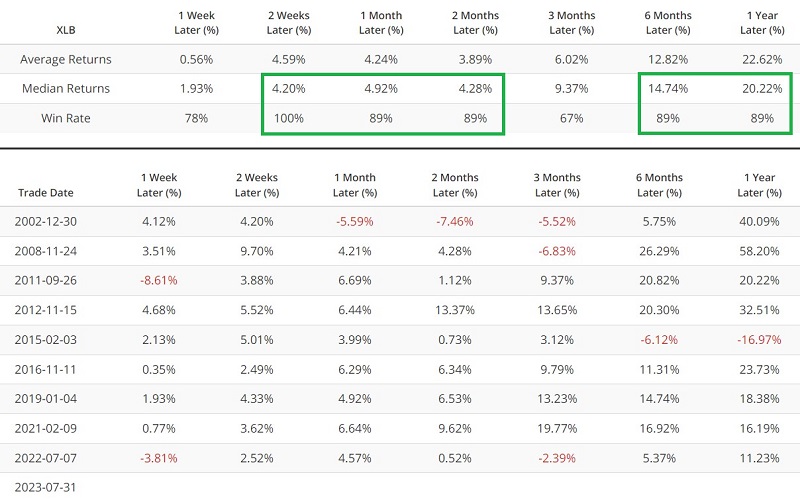
Materials sector (XLB)
The chart and table below display Materials Select Sector SPDR Fund (XLB) performance following the abovementioned signal.
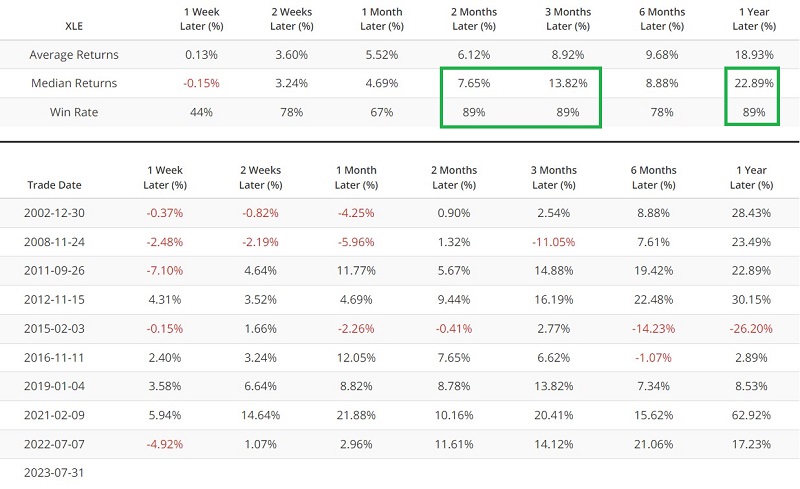
Energy sector (XLE)
The chart and table below display Energy Select Sector SPDR Fund (XLE) performance following the abovementioned signal.

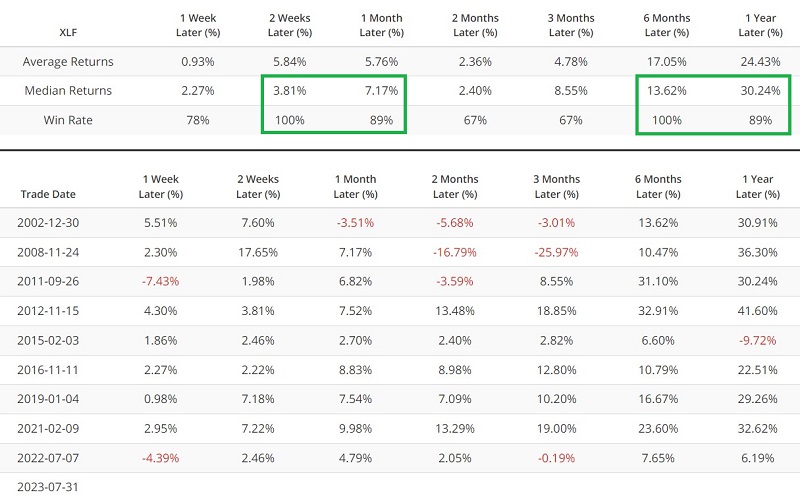
Financial sector (XLF)
The chart and table below display Financial Select Sector SPDR Fund (XLF) performance following the abovementioned signal.
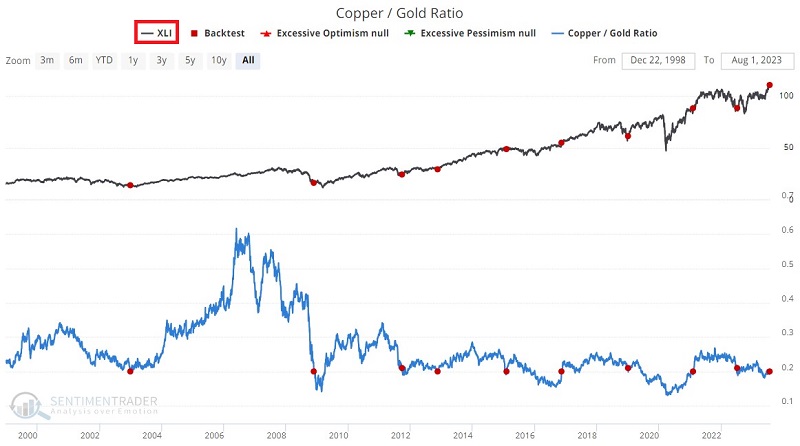
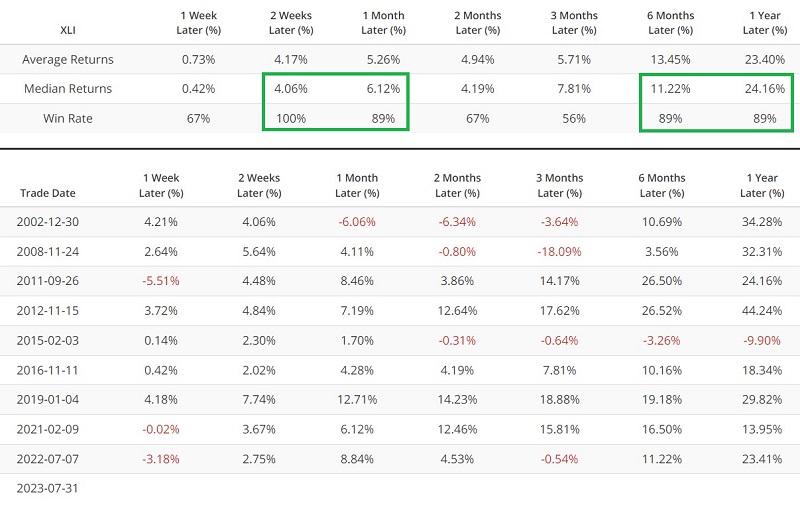
Industrial sector (XLI)
The chart and table below display Industrial Select Sector SPDR Fund (XLI) performance following the abovementioned signal.
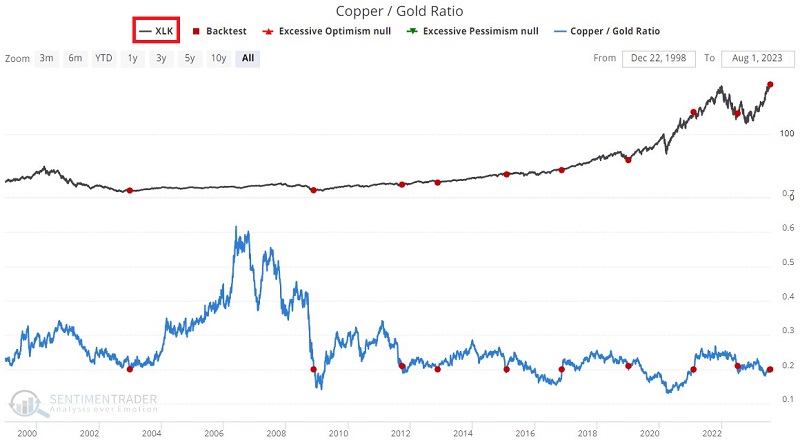
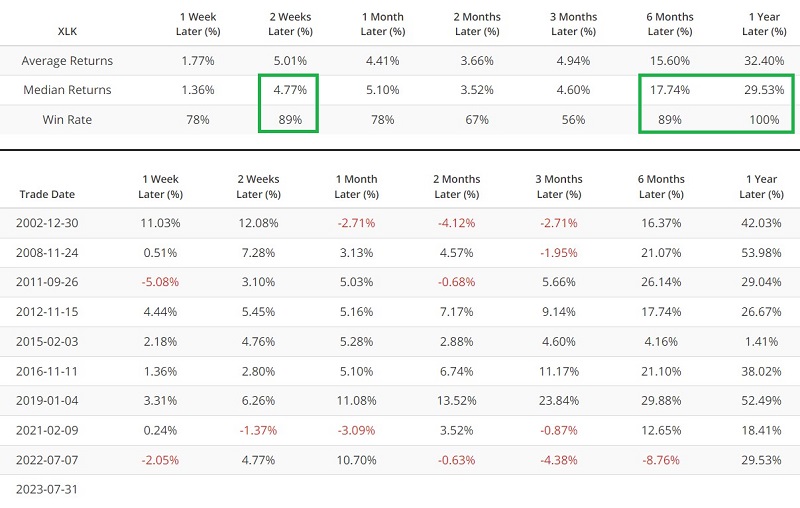
Technology sector (XLK)
The chart and table below display Technology Select Sector SPDR Fund (XLK) performance following the abovementioned signal.
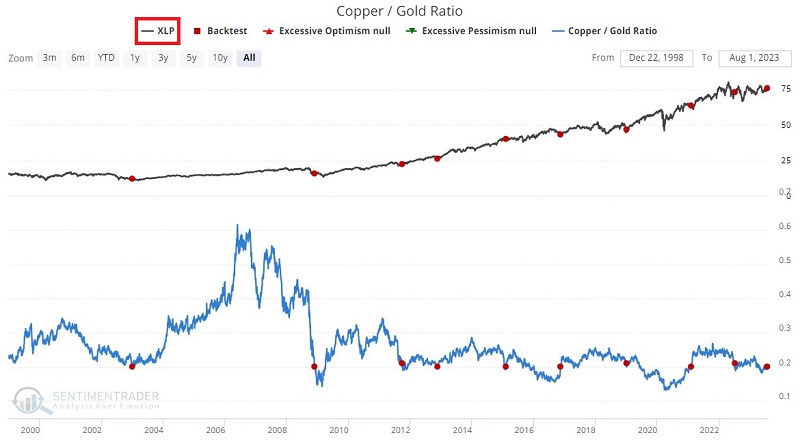
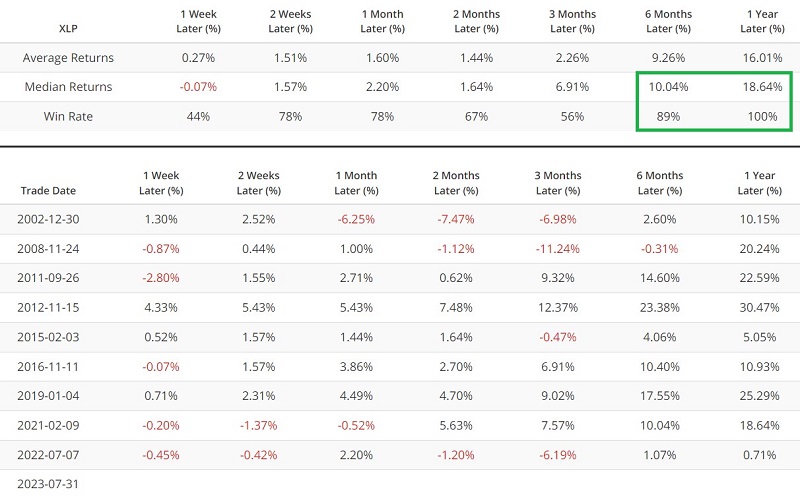
Consumer Staples sector (XLP)
The chart and table below display Consumer Staples Select Sector SPDR Fund (XLP) performance following the abovementioned signal.
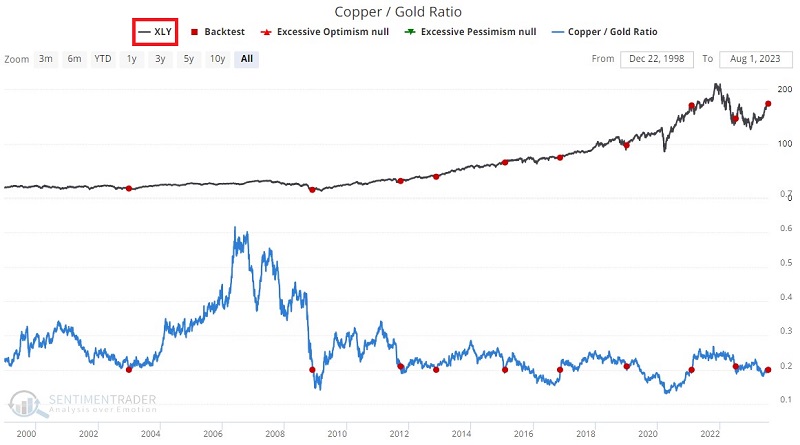
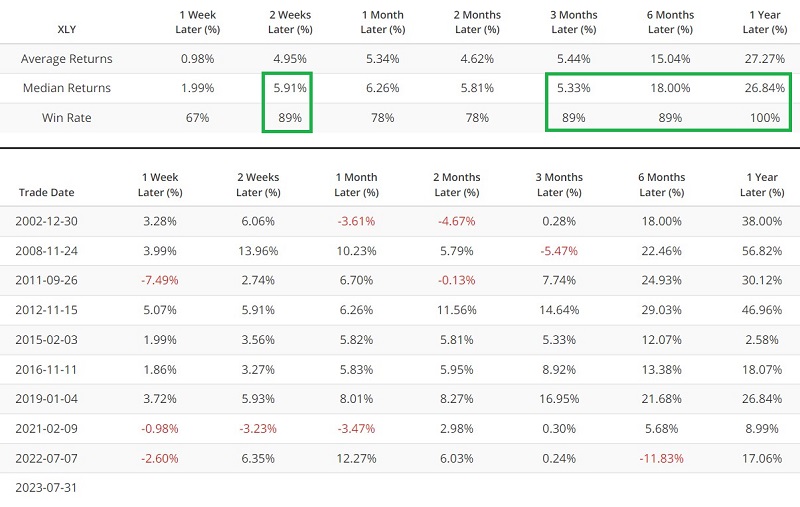
Consumer Discretionary sector (XLY)
The chart and table below display Consumer Discretionary Select Sector SPDR Fund (XLY) performance following the abovementioned signal.
What the research tells us…
To repeat, it would be difficult to pinpoint why a cross by the Copper/Gold Ratio above (or below) some specific value would trigger a particular price movement in some tradable asset that does not directly involve either copper or gold. Yet the numbers are what they are. Certain assets have shown a solid propensity to rally sharply in the short-term (particularly commodities and several stock sectors) and over 6 to 12 months (including international stocks, up 90% of the time 12 months after a signal). On the other hand, bonds and the Japanese Yen have shown significant weakness across most all time frames up to 12 months.