Data &
Technology
Research
Reports
Report Solutions
Reports Library
Actionable
Strategies
Free
Resources
Simple Backtest Calculator
Simple Seasonality Calculator
The Kelly Criterion Calculator
Sentiment Geo Map
Public Research Reports
Free Webinar
Pricing
Company
About
Meet Our Team
In the News
Testimonials
Client Success Stories
Contact
Log inLoginSign up
< BACK TO ALL REPORTS

The Closest 200-Day Comparisons

Jason Goepfert
2021-09-15
The past 200 days in the S&P 500 have been among the index's most consistent ever. But there have been 18 other stretches that show a very high positive correlation, so we look at these analogs and see some short-term weakness among many of them.

It's easy to look at a chart and cherry-pick dates to say, "Hey this looks just like that!" and make a conclusion. One of the common ones lately has been comparing the last 200 days to the initial thrust off past bear market bottoms.

Fair enough, but the past 200 sessions have been remarkable for their calm. Most other kick-offs have suffered at least some volatility along the way.

If we use the objective calculations we always do for analogs, then we can look at other 200-day periods in the S&P 500's history to see which ones have the highest correlation to the recent past. It turns out there were 18 other stretches with a very high correlation, when the S&P was also trading at a multi-year high at the time.

The chart below shows the last 200 days in the index (blue) along with an average of the 18 stretches with the highest correlation (black).

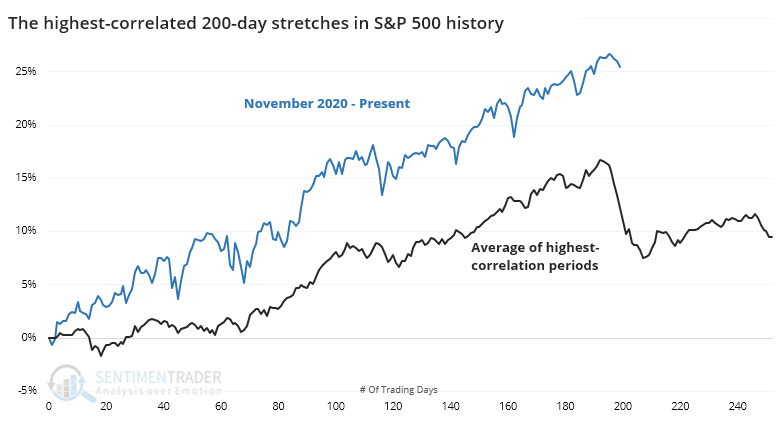
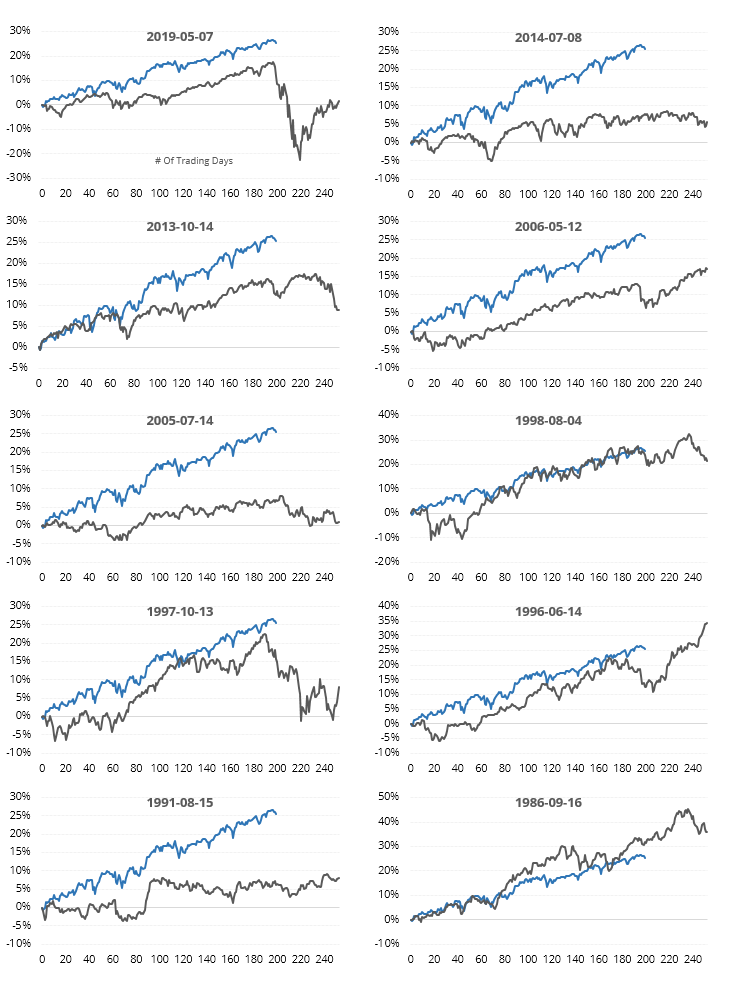
The chart shows that the average analog suffered a pullback right about now. When we look at thumbnails of the 10 most recent occurrences, we see how consistent that was.

A TENDENCY FOR SHORT-TERM DIPS

What we should be most interested in is future returns. If we look at the ends of the 200-day periods shown above, then we can see how the S&P fared going forward.

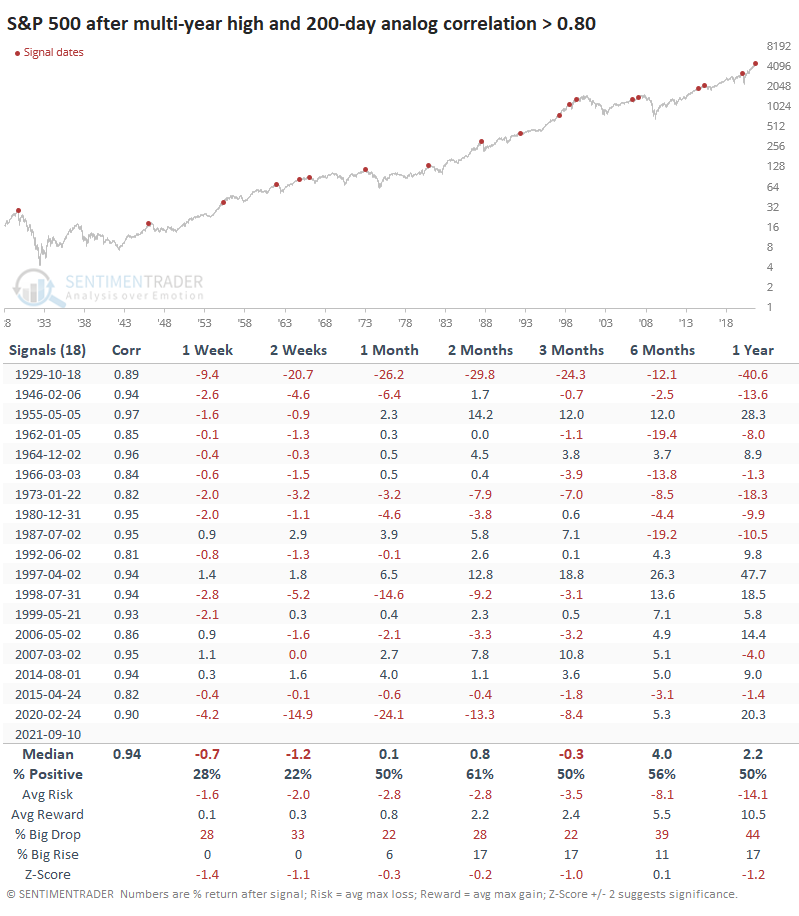
Shorter-term returns were not great, reflecting those pullbacks that we saw in the thumbnails. Across most time frames, the S&P's returns were below random, and the overall risk/reward was very poor.

One difference with our current market is just how strong the momentum and (mostly) breadth have been. The S&P just ended a historic streak with more than 75% of its members above their long-term trends, which showed that any shorter-term dips had a strong tendency to rebound in the months ahead. The current trend has been so calm, for so long, that an interruption would be par for the course but it would be rare for it to turn into a rout just yet.

Sorry, you don't have access to this report

Upgrade your subscription plan to get access
Go to Dasboard
DATA &
TECHnologies
IndicatorEdge
‍
BackTestEdge
‍
Other Tools
‍
DataEdge API
RESEARCH
reports
Research Solution
‍
Reports Library
‍
actionable
Strategies
Trading Strategies
‍
Smart Stock Scanner
‍
FREE
RESOUrCES
Simple Backtest
Calculator
Simple Seasonality
Calculator
The Kelly Criterion
Calculator
Sentiment Geo Map
‍
Public Research Reports
‍
Free Webinar
COMPANY
‍
About
‍
Meet our Team
‍
In the News
‍
Testimonials
‍
Client Success Stories
Pricing
Bundle pricing
‍
Announcements
‍
FAQ
© 2024 Sundial Capital Research Inc. All rights reserved.
Setsail Marketing
TermsPrivacyAffiliate Program
Risk Disclosure: Futures and forex trading contains substantial risk and is not for every investor. An investor could potentially lose all or more than the initial investment. Risk capital is money that can be lost without jeopardizing ones’ financial security or life style. Only risk capital should be used for trading and only those with sufficient risk capital should consider trading. Past performance is not necessarily indicative of future results.

Hypothetical Performance Disclosure: Hypothetical performance results have many inherent limitations, some of which are described below. No representation is being made that any account will or is likely to achieve profits or losses similar to those shown; in fact, there are frequently sharp differences between hypothetical performance results and the actual results subsequently achieved by any particular trading program. One of the limitations of hypothetical performance results is that they are generally prepared with the benefit of hindsight. In addition, hypothetical trading does not involve financial risk, and no hypothetical trading record can completely account for the impact of financial risk of actual trading. for example, the ability to withstand losses or to adhere to a particular trading program in spite of trading losses are material points which can also adversely affect actual trading results. There are numerous other factors related to the markets in general or to the implementation of any specific trading program which cannot be fully accounted for in the preparation of hypothetical performance results and all which can adversely affect trading results.

Testimonial Disclosure: Testimonials appearing on this website may not be representative of other clients or customers and is not a guarantee of future performance or success.