
The Benner Cycle - Part I

Key points
- The chart below was purportedly created by a man named Samuel Benner in 1875
- In theory, it was intended to identify "boom" and "bust" cycles in the economy
- Because stock market performance is so closely tied to the economy, this series takes a look at performance across the various favorable and unfavorable periods within the "Benner Cycle"
The "Benner Cycle" chart
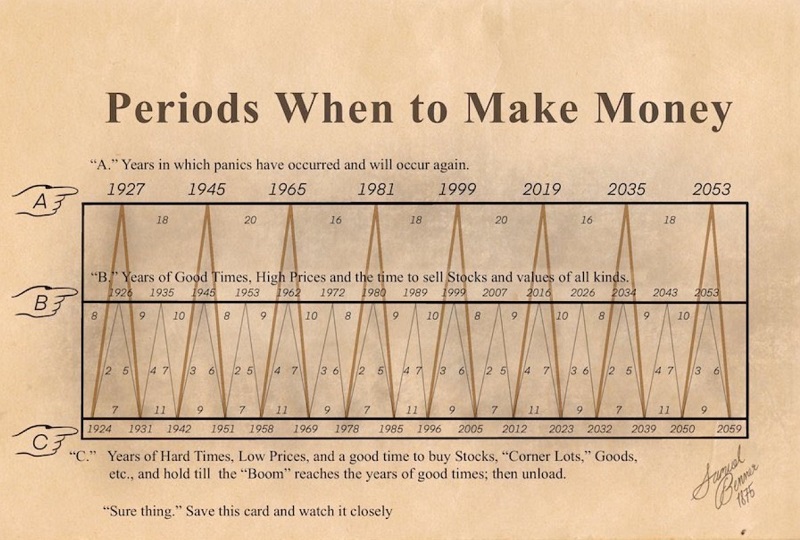
The chart below was purportedly created by Samuel Benner in 1875.
According to BusinessInsider.com:
Samuel Benner was a prosperous farmer who was wiped out financially by the 1873 panic. When he tried to discern the causes of market fluctuations, he came across a significant degree of cyclicality.
Benner eventually published his findings in a book in 1875 - BENNERS PROPHECIES: FUTURE UPS AND DOWNS IN PRICEs - making business and commodity price forecasts for 1876 -1904. Many (but not all) of these forecasts were pretty accurate.
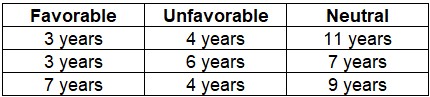
As you can see in the chart above, there is a major cycle and a minor cycle. The "major cycle" (the orange/yellow line) starts by rising from 1924 to 1927 (favorable), then declines from 1927 to 1931 (unfavorable). This line is then non-existent for 11 years until 1942 (neutral). Starting in 1924, this major cycle progressed as follows:
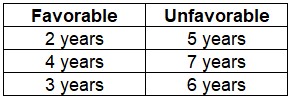
The "minor" cycle (the light gray line) starts by rising from 1924 to 1926 (favorable), then declines from 1926 to 1931. It then increases for four years and declines for 7, then completes its pattern by rising for three years, then falling for 6. From there (1951), the overall pattern repeats.
For this piece, we will look only at the "major cycles" - i.e., the orange/yellow line that starts by rising from 1924 to 1927 (bullish), then declines from 1927 to 1931 (bearish), etc.
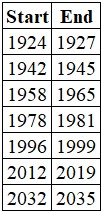
Let's look first at "favorable" years within the major Benner cycle - i.e., years when the orange/yellow line is rising. Note that for all tests, we start a new cycle period at the close on December 31st of the indicated year and use monthly S&P 500 Index closing prices to track results.
Favorable years within the major Benner cycle
The list below contains all the "favorable" years the major Benner cycle indicated.
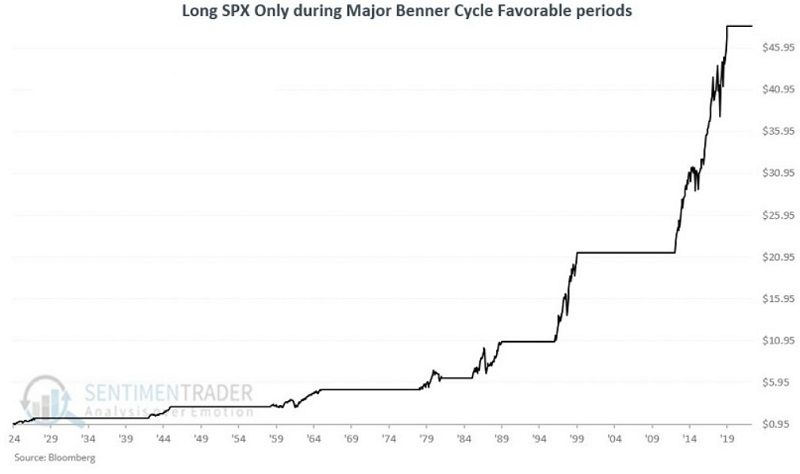
The chart below displays the growth of $1 invested only during the periods listed above.
The chart below displays the same results on a logarithmic scale.
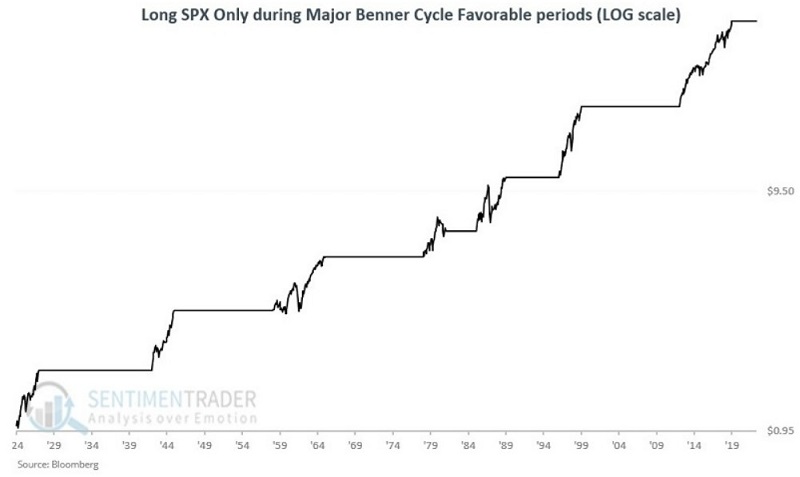
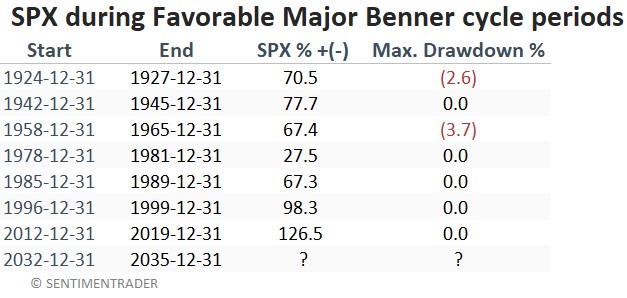
Not perfect, of course, but not a bad-looking equity curve. The table below displays the cycle-by-cycle results plus the largest drawdown from the entry price. Note that the results are generated using month-end prices, so the maximum drawdown within a given period may be larger than what appears in the table below.
Unfavorable years within the major Benner cycle
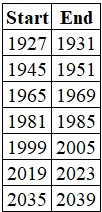
The list below contains all the "unfavorable" years the major Benner cycle indicates.
The chart below displays the growth of $1 invested only during the periods listed above.
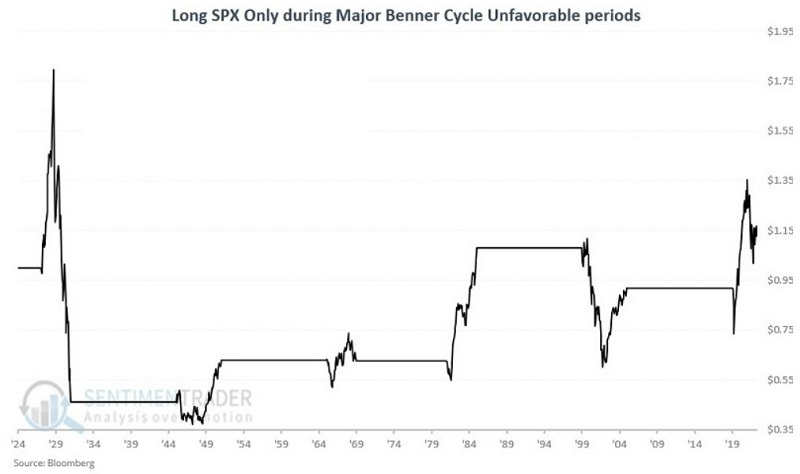
The results above are not "uniformly bearish"; however, most all periods include a severe bear market and significant volatility. The overall net return is a fraction of those achieved during favorable years.
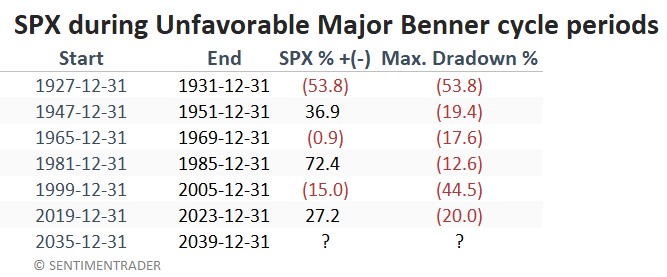
The table below displays the cycle-by-cycle results. Note the magnitude of the drawdowns compared to those shown above for favorable years. Note that the results are generated using month-end prices, so the maximum drawdown within a given period may be larger than what appears in the table below.
What the research tells us…
The major Benner cycle should not be confused with a "trading system." Likewise, the dates of major favorable and unfavorable periods should not be considered automatic buy and sell signals. Still, the stock market has experienced almost uniformly positive results during favorable periods - and decidedly mixed and much more volatile results during unfavorable periods. Thus, the major Benner cycle is potentially helpful as a "weight of the evidence" tool.