Data &
Technology
Research
Reports
Report Solutions
Reports Library
Actionable
Strategies
Free
Resources
Simple Backtest Calculator
Simple Seasonality Calculator
The Kelly Criterion Calculator
Sentiment Geo Map
Public Research Reports
Free Webinar
Pricing
Company
About
Meet Our Team
In the News
Testimonials
Client Success Stories
Contact
Log inLoginSign up
< BACK TO ALL REPORTS

Stocks in the S&P 500 Have Made a Stunning Comeback

Jason Goepfert
2021-10-20
There has been a big thrust in S&P 500 members trading above their 10-day moving averages.

At various points during the summer, there were odd stretches where indexes like the S&P 500 were pushing higher but with a troubling lack of participation.

Each time, the situations resolved by the indexes moving even higher. As the indexes stumbled in September, though, there was a quick washout among stocks. By September 20, fewer than 10% of stocks in that index held above their 10-day moving averages.

Then buyers stepped in, and by the end of last week, more than 80% of members were trading above their averages, a stark change in less than a month.

There is a thrust in S&P 500 members above their 10 day moving average

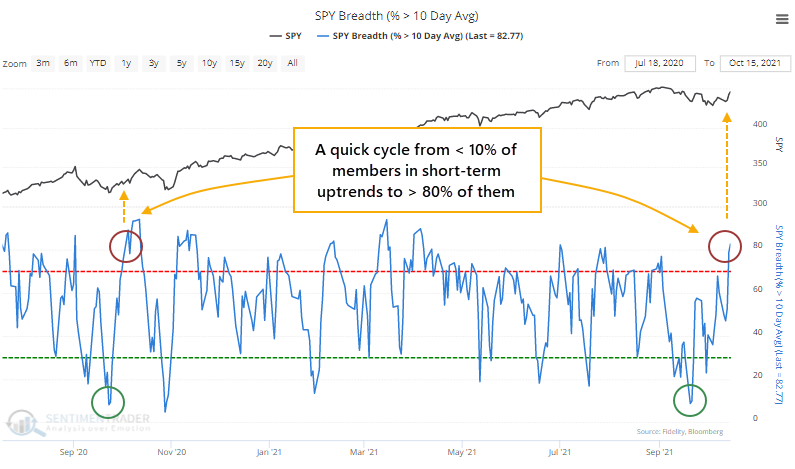
The only recent time we saw a similar move was almost exactly a year ago. That essentially marked the end of that corrective period.

Typically, breadth swings like this during times of general market volatility. It's much rarer to see cycles from very low to very high figures within a few weeks of each other when stocks are trading near their highs.

When we go back to 1928 and look for times when fewer than 10% of S&P members were above their 10-day averages, then more than 80% of them were within a month, only a handful of signals triggered when the S&P was trading within 1.5% of a multi-year high. 


What else we're looking at

  • What breadth thrusts meant for the S&P 500 when it was near a peak
  • Our Risk-On/Risk-Off Model is triggering a reversal signal
  • A way to use Smart and Dumb Money Confidence that showed gains every time

Stat box

The Market Vectors Oil Services ETF (OIH) has risen for 9 consecutive sessions. That's the longest streak since its inception, beating the prior record from early November 2017.

Etcetera

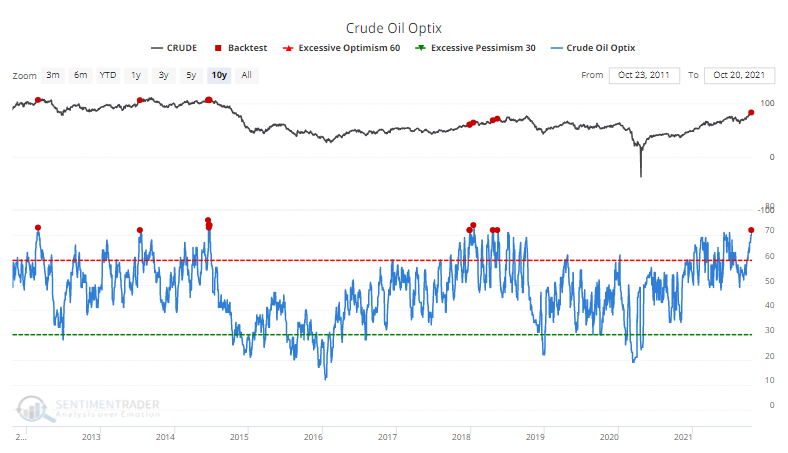
Crude hopes. Traders are among the most bullish on crude oil in a decade. At 72%, the Optimism Index now ranks among the highest readings since 2012. Our Backtest Engine, available to all premium users, shows an average return of -4.8% in the two months following other high readings.

Crude oil optimism is extremely high

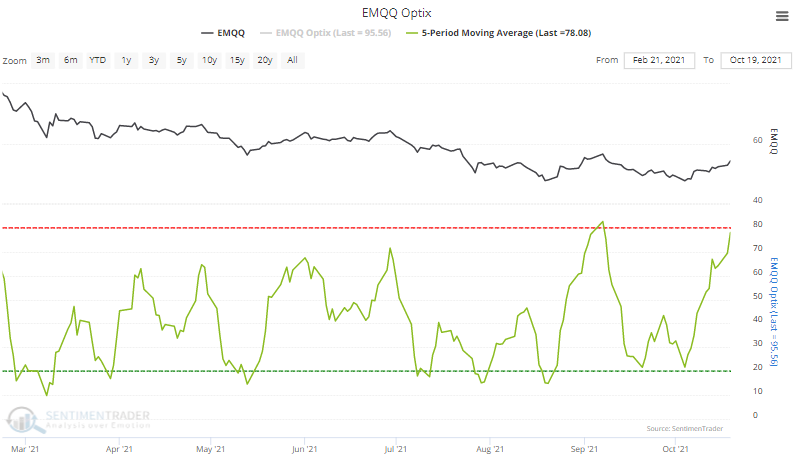
Nothing but 'net. Emerging market technology stocks, and Chinese internet stocks, in particular, were among the most hated stocks in the world a few weeks ago. Times have changed. Over the past five days, the average Optimism Index on EMQQ has risen to its 2nd-highest level in a year.

Optimism is returning to emerging market technology stocks

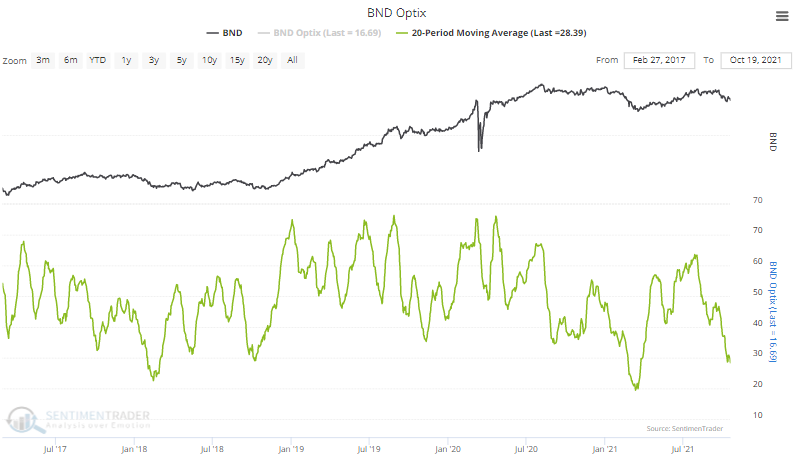
BDSM. That's shorthand for Bond Decline Sinks Morale, you cheeky buggers. Over the past 20 sessions, the Optimism Index on the BND fund has averaged less than 30%. This is only the 3rd time it's been so low, for so long, in the past five years.

The BND bond fund is seeing very low optimism

DATA &
TECHnologies
IndicatorEdge
‍
BackTestEdge
‍
Other Tools
‍
DataEdge API
RESEARCH
reports
Research Solution
‍
Reports Library
‍
actionable
Strategies
Trading Strategies
‍
Smart Stock Scanner
‍
FREE
RESOUrCES
Simple Backtest
Calculator
Simple Seasonality
Calculator
The Kelly Criterion
Calculator
Sentiment Geo Map
‍
Public Research Reports
‍
Free Webinar
COMPANY
‍
About
‍
Meet our Team
‍
In the News
‍
Testimonials
‍
Client Success Stories
Pricing
Bundle pricing
‍
Announcements
‍
FAQ
© 2024 Sundial Capital Research Inc. All rights reserved.
Setsail Marketing
TermsPrivacyAffiliate Program
Risk Disclosure: Futures and forex trading contains substantial risk and is not for every investor. An investor could potentially lose all or more than the initial investment. Risk capital is money that can be lost without jeopardizing ones’ financial security or life style. Only risk capital should be used for trading and only those with sufficient risk capital should consider trading. Past performance is not necessarily indicative of future results.

Hypothetical Performance Disclosure: Hypothetical performance results have many inherent limitations, some of which are described below. No representation is being made that any account will or is likely to achieve profits or losses similar to those shown; in fact, there are frequently sharp differences between hypothetical performance results and the actual results subsequently achieved by any particular trading program. One of the limitations of hypothetical performance results is that they are generally prepared with the benefit of hindsight. In addition, hypothetical trading does not involve financial risk, and no hypothetical trading record can completely account for the impact of financial risk of actual trading. for example, the ability to withstand losses or to adhere to a particular trading program in spite of trading losses are material points which can also adversely affect actual trading results. There are numerous other factors related to the markets in general or to the implementation of any specific trading program which cannot be fully accounted for in the preparation of hypothetical performance results and all which can adversely affect trading results.

Testimonial Disclosure: Testimonials appearing on this website may not be representative of other clients or customers and is not a guarantee of future performance or success.