Data &
Technology
Research
Reports
Report Solutions
Reports Library
Actionable
Strategies
Free
Resources
Simple Backtest Calculator
Simple Seasonality Calculator
The Kelly Criterion Calculator
Sentiment Geo Map
Public Research Reports
Free Webinar
Pricing
Company
About
Meet Our Team
In the News
Testimonials
Client Success Stories
Contact
Log inLoginSign up
< BACK TO ALL REPORTS

Stocks End Historic Trend of Long Term Positive Trends

Jason Goepfert
2021-09-14
For the first time in more than 200 days, fewer than 75% of stocks in the S&P 500 managed to hold above their 200-day moving averages. That ends the 4th-longest streak of such positive breadth since 1928.

It was quite a run, but the dip in stocks last week did a bit of damage.

We've seen from multiple perspectives just how much of an outlier 2021 has been in terms of sentiment, breadth, and momentum. At various points since January, momentum ebbed, or negative breadth divergences triggered, then buyers came in immediately.

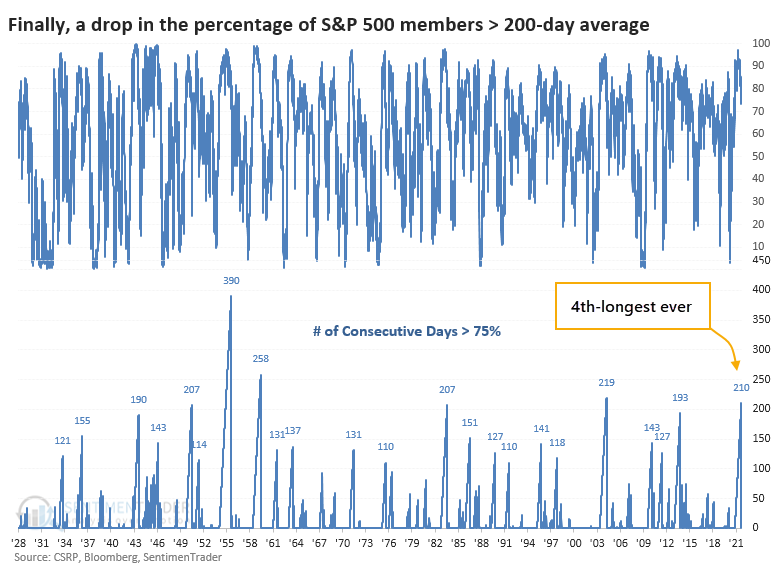
Yet, at no time did fewer than 75% of S&P stocks close below their long-term averages until the end of last week. For the first time in 10 months, fewer than 3 out of every 4 stocks in the S&P 500 closed above their 200-day moving averages.

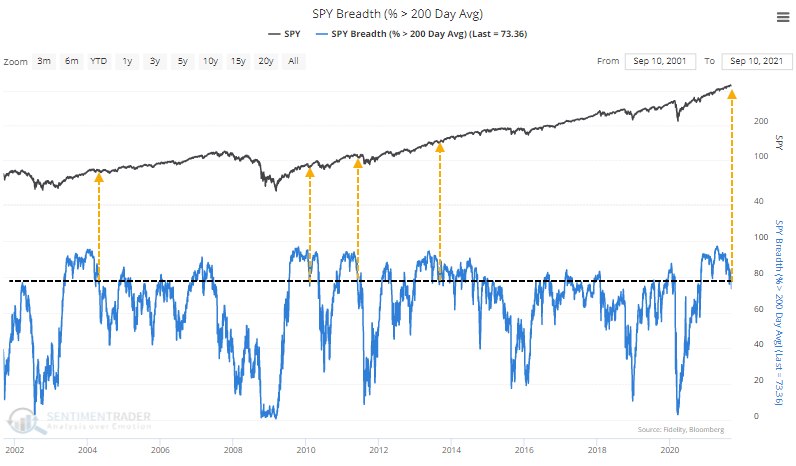
That ends the 4th-longest streak since at least 1928.

A DECENT MEDIUM-TERM SIGN

In over 90 years of history, there have only been 5 other streaks of at least 200 consecutive days. Like we see with many momentum types of data, forward returns were good, even after the streaks ended. While it did precede a big dip in 1950, the others saw minimal losses or gains over the following months.

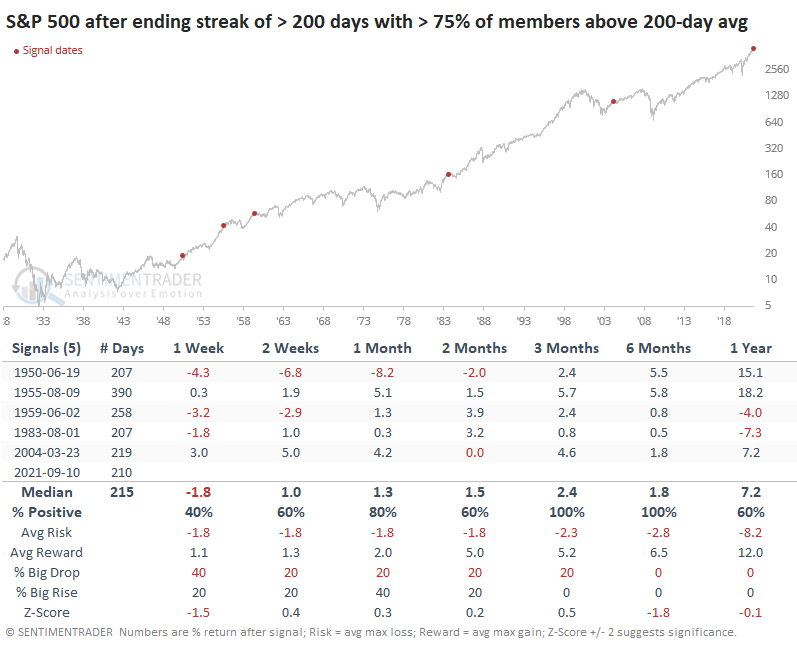
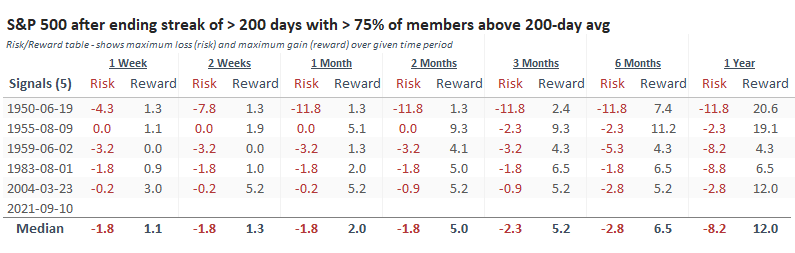
The Risk/Reward Table highlights the positive skew, with 1950 being the clear outlier. About the only negative is that risk exceeded reward over the next 2-4 weeks after three of the five precedents.

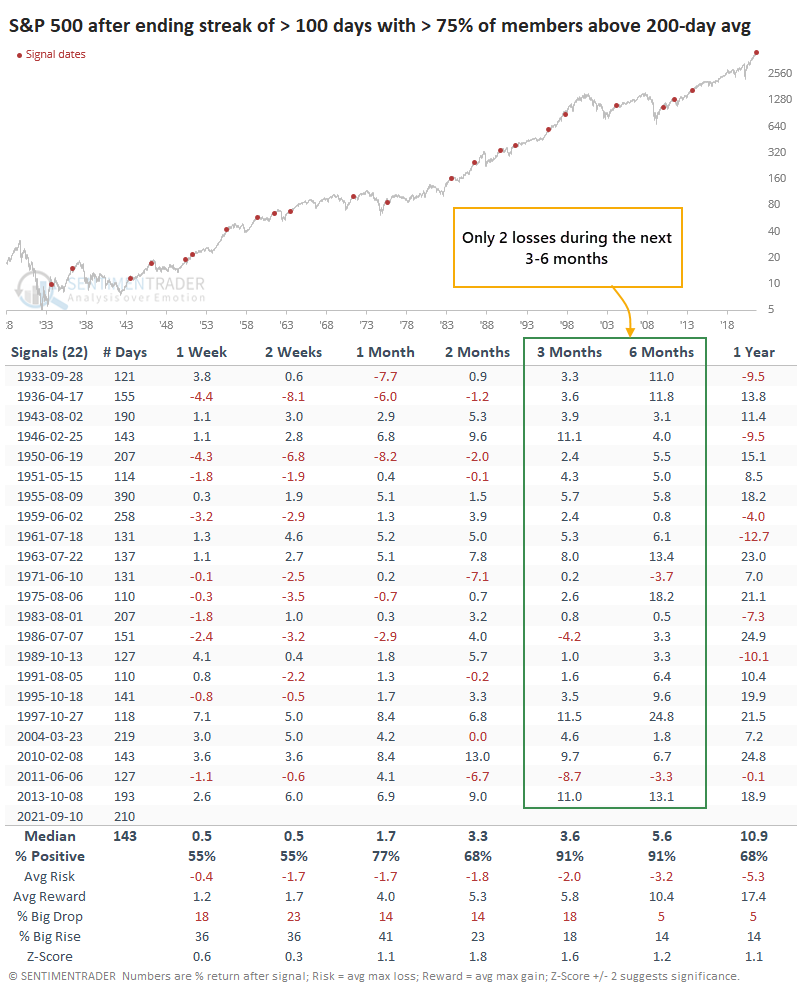
LOOKING AT A BIGGER SAMPLE

A bigger sample size is usually better, so if we relax the parameters to look for the ends of streaks of at least 100 days, shorter-term returns were mediocre, but medium- to long-term ones were very good. The consistency was impressive, with only 2 losses out of 22 signals over the next 3-6 months.

Impressive momentum has been a feature of this market since the initial thrusts off of the 2020 low. It's hard (impossible) to reconcile it against other worries like deteriorating macro conditions combined with a rising bear market probability. No worries have mattered for nearly a year, so counting on them to matter now is like tilting at windmills.

There are compelling worries out there, and there are some signs of deteriorating momentum. However, the simple fact that it has lasted so long suggests that any declines should be relatively mild and relatively brief. The longer-term worries will have more imminent respect when (or if) we see more, and longer-lasting, deterioration in the stock and corporate bond market.

Sorry, you don't have access to this report

Upgrade your subscription plan to get access
Go to Dasboard
DATA &
TECHnologies
IndicatorEdge
‍
BackTestEdge
‍
Other Tools
‍
DataEdge API
RESEARCH
reports
Research Solution
‍
Reports Library
‍
actionable
Strategies
Trading Strategies
‍
Smart Stock Scanner
‍
FREE
RESOUrCES
Simple Backtest
Calculator
Simple Seasonality
Calculator
The Kelly Criterion
Calculator
Sentiment Geo Map
‍
Public Research Reports
‍
Free Webinar
COMPANY
‍
About
‍
Meet our Team
‍
In the News
‍
Testimonials
‍
Client Success Stories
Pricing
Bundle pricing
‍
Announcements
‍
FAQ
© 2024 Sundial Capital Research Inc. All rights reserved.
Setsail Marketing
TermsPrivacyAffiliate Program
Risk Disclosure: Futures and forex trading contains substantial risk and is not for every investor. An investor could potentially lose all or more than the initial investment. Risk capital is money that can be lost without jeopardizing ones’ financial security or life style. Only risk capital should be used for trading and only those with sufficient risk capital should consider trading. Past performance is not necessarily indicative of future results.

Hypothetical Performance Disclosure: Hypothetical performance results have many inherent limitations, some of which are described below. No representation is being made that any account will or is likely to achieve profits or losses similar to those shown; in fact, there are frequently sharp differences between hypothetical performance results and the actual results subsequently achieved by any particular trading program. One of the limitations of hypothetical performance results is that they are generally prepared with the benefit of hindsight. In addition, hypothetical trading does not involve financial risk, and no hypothetical trading record can completely account for the impact of financial risk of actual trading. for example, the ability to withstand losses or to adhere to a particular trading program in spite of trading losses are material points which can also adversely affect actual trading results. There are numerous other factors related to the markets in general or to the implementation of any specific trading program which cannot be fully accounted for in the preparation of hypothetical performance results and all which can adversely affect trading results.

Testimonial Disclosure: Testimonials appearing on this website may not be representative of other clients or customers and is not a guarantee of future performance or success.