
Soybean seasonality and sentiment flash a warning

Key Points
- Soybeans enjoyed a terrific run from May 2020 into June 2022
- A recent -27% plunge has traders wondering what will come next
- Seasonality and sentiment are presently arguing that more weakness is in store in the months directly ahead
Seasonality
The chart below displays the annual seasonal trend for soybean futures. The implication of the red box is pretty apparent.
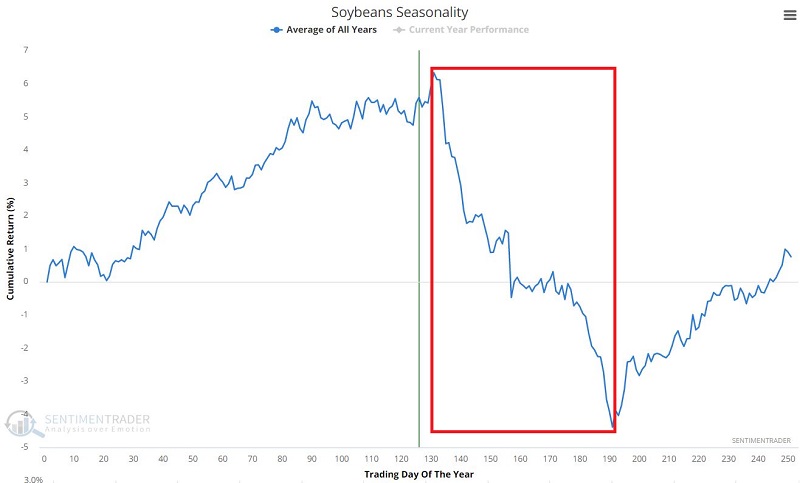
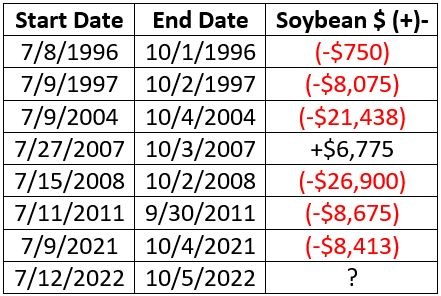
The unfavorable seasonal period for beans extends from the close on Trading Day of the Year (TDY) #131 and extends through TDY #191. For 2022 this period extends from the close on 7/12/2022 through the close on 10/5/2022.
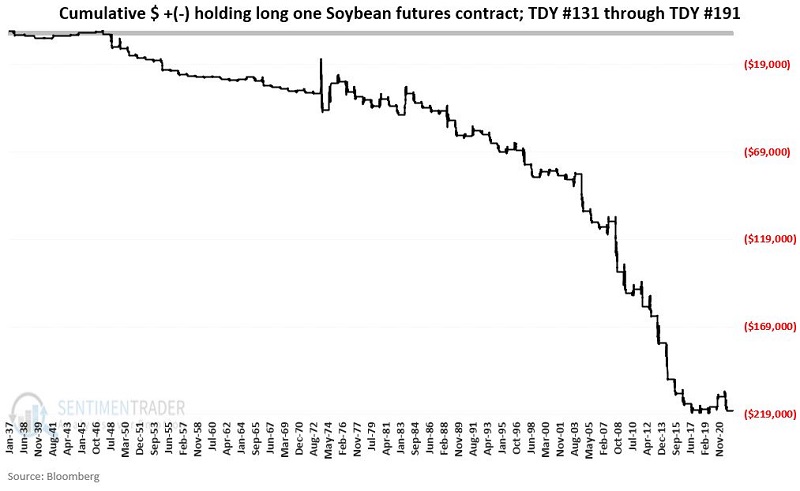
Does this mean that soybeans are sure to decline between these two dates? Not at all. But let's look at some history to understand what we might expect. The chart below displays the hypothetical cumulative gain/loss achieved by holding long a soybean futures contract from TDY #131 through TDY #191 every year since 1937.
 Once again, the implication is pretty obvious. To put some numbers to it, the table below displays a summary of annual results.
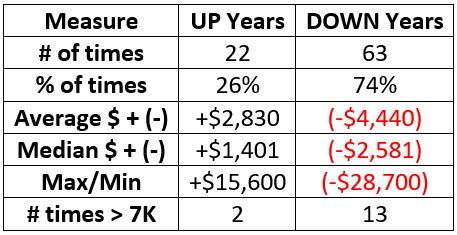
Roughly three of every four years has seen soybeans decline during this seasonally unfavorable period.
Sentiment
It is not surprising to learn that trader sentiment towards soybeans turned very bullish during the run-up in early to mid-2022. But what does this significantly bullish sentiment suggest for beans as we advance?
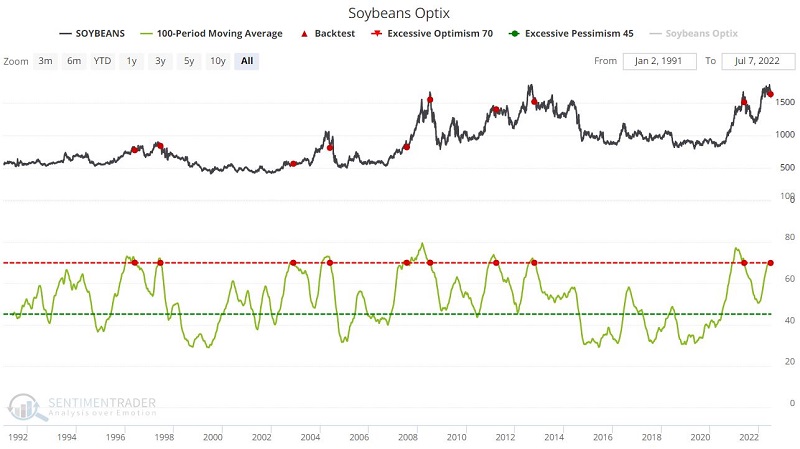
The chart below displays those times when the 100-day moving average for Soybean Optix dropped below 70%. In other words, this test looks for a period when soybean Optix is high for an extended time, and then "the bloom comes off the rose" (or the crop, in this case).
The latest signal occurred on 7/1/2022. The table below displays a summary of soybean futures performance following previous signals.
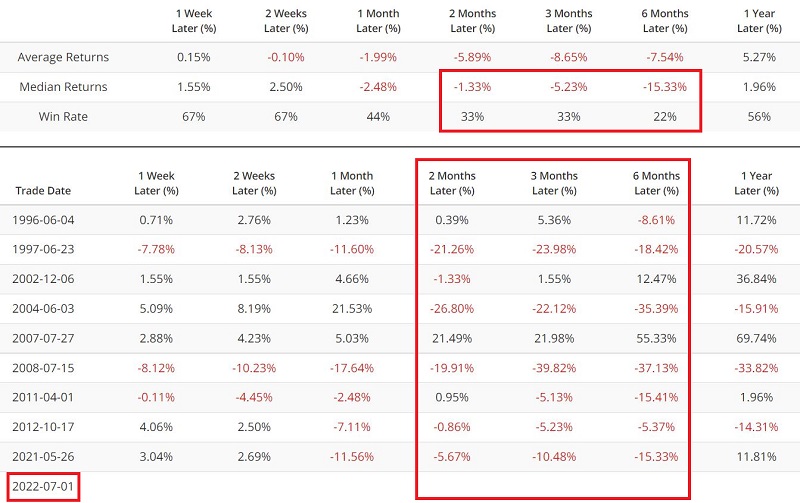
The table above shows that the "Not So Sweet Spot" is between two and six months after a signal. At this moment, the latest signal dovetails closely with the seasonally unfavorable period discussed earlier. Now let's put seasonality and sentiment together.
Seasonality and Sentiment Combined
Let's first create a simple Soybean Seasonality and Sentiment (SSS) Model.
A = If today is between TDY #132 and #191 then -1
B = If the 100-day average of Soybean Optix dropped from above 70 to below 70 anytime in the last -126 trading days, then -1
C = A + B
SSS Model = C
The bottom line:
- If neither indicator is bearish, the SSS Model will equal 0
- If either indicator is bearish, the SSS Model will equal -1
- If both indicators are bearish, the SSS Model will equal -2
Recent readings:
- Through 7/1/2022, the SSS Model stood at 0
- From 7/2/2022 through 7/12/2022, the SSS Model will read -1
- From 7/13/2022 through 10/5/2022, the SSS Model will read -2
Our Soybean Optix data starts in 1996, so our test runs from 12/31/1995 through 7/6/2022.
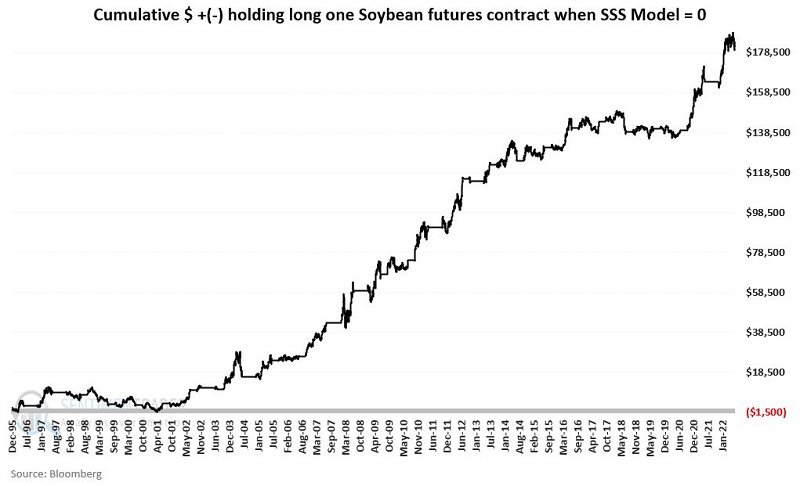
SSS Model = 0
The table below displays the cumulative hypothetical return from holding long a soybean futures contract when the SSS Model = 0. The cumulative gain is +$181,425.
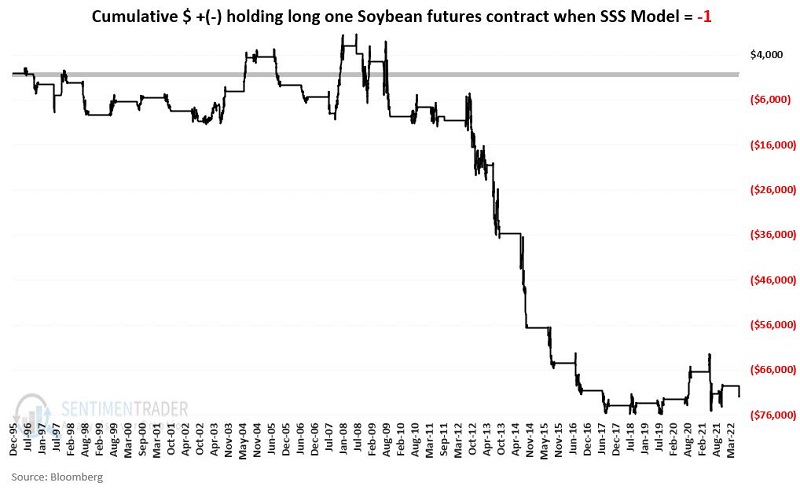
SSS Model = -1
The table below displays the cumulative hypothetical return from holding long a soybean futures contract when the SSS Model = -1. The cumulative loss is -$71,700.
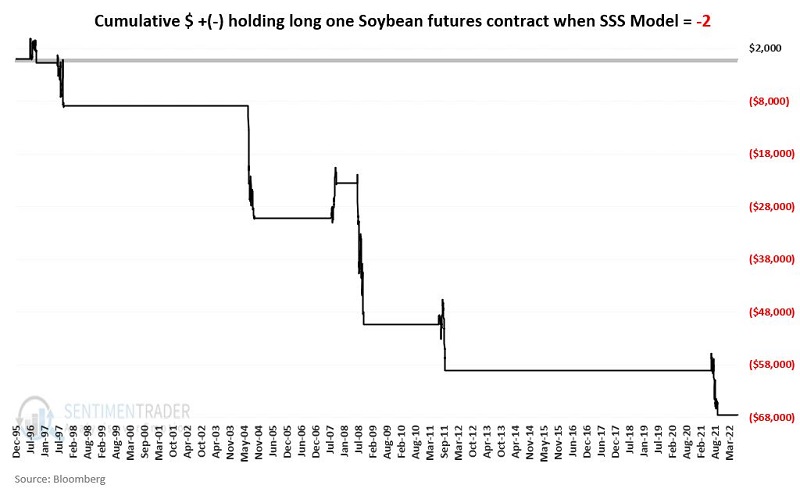
SSS Model = -2
The table below displays the cumulative hypothetical return from holding long a soybean futures contract when the SSS Model = -2. The cumulative loss is -$67,475.
The table below displays those times when the SSS Model was equal to -2.
NOTE: The SSS Model is presently at -1 and will be at -2 from the close on 7/12/2022 through the close on 10/5/2022.
What the research tells us…
Soybeans have demonstrated a tendency to perform poorly from mid-July into early October. In addition, when Soybean Optix has reversed lower from a high level, future performance over the ensuing two to six months has tended to show weakness. When both factors are unfavorable, soybean performance has been particularly adverse.
Will this year's negative period show more of the same, or will it be the exception to the rule as in 2007? There is no way to know in advance. But the bottom line is that aggressive traders might look to play the short side of soybeans, and bullish traders had best make sure they have a solid reason to risk money on the long side of beans in the months ahead.