Data &
Technology
Research
Reports
Report Solutions
Reports Library
Actionable
Strategies
Free
Resources
Simple Backtest Calculator
Simple Seasonality Calculator
The Kelly Criterion Calculator
Sentiment Geo Map
Public Research Reports
Free Webinar
Pricing
Company
About
Meet Our Team
In the News
Testimonials
Client Success Stories
Contact
Log inLoginSign up
< BACK TO ALL REPORTS

Shorts have left the market

Jason Goepfert
2021-02-04
The median short interest in stocks in the S&P 500, Dow Industrials, Nasdaq 100, and Russell 2000 is the lowest in 17 years.

The big topic over the past week has been short interest. By the sounds of mainstream media, there's a massive build-up of shares that greedy hedge funds have borrowed and sold, hoping to buy them back later at a lower price.

As usual, it's uninformed hyperbole. Short sellers provide an invaluable service to the investment world, and in any case, their thesis is completely wrong. In some stocks, there surely had been a huge build in the number of shares sold short.

In the average stock, not so much. The average stock across the S&P, Dow Industrials, Nasdaq 100, and Russell 2000 has just over 2% of its float sold short, a 17-year low. 
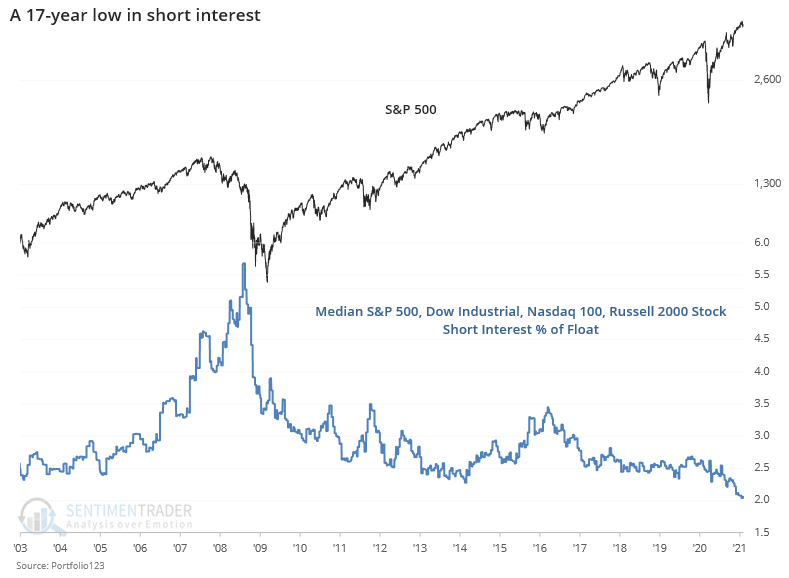
Median S&P 500 Dow Industrials Nasdaq 100 Russell 2000 short interest

Across the broad NYSE universe, the Short Interest Ratio is near the lowest level in 20 years. Same for the Nasdaq exchange. Our de-trended look at short interest is near the lowest level in 70 years.

One of the main benefits of a healthy base of investors willing to sell short is that it helps to keep companies honest. Instead of the rah-rah "Great quarter, guys" from many analysts whose firms have investment banking relationships, shorts cast a skeptical eye and are willing to ask tougher questions.

Perhaps it's never been more important. As companies emerge from the chaos of last spring, many of them are still losing money. More than 7% of firms within the S&P 500 are showing negative operating earnings over the past 12 months, the highest percentage in over a decade.

What else we're looking at

  • A look at short interest as a % of float in the S&P 500 since 1999
  • A long-term look and historical performance when de-trended short interest is very low
  • The percentage of companies in the S&P 500 (and other major indexes) that have lost money over the past year
  • Money-losing IPOs account for a near-record percentage of issues
  • How to implement a bear put strategy
  • What happens when newsletters start to turn cautious even though stocks are strong

Stat Box

The VIX "fear gauge" has dropped more than 8% for 3 consecutive sessions, but it's still elevated above 20. That's only happened twice before, in the past 30 years. Those were in August 1990 and August 2015.


Sentiment from other perspectives

At least some investors are worried. A peculiar survey of institutional investors shows that they're the least optimistic on stocks' future returns in at least 20 years. Source: Yale
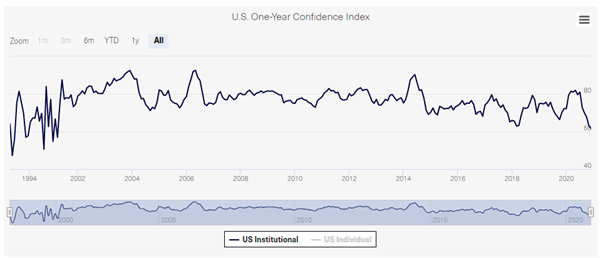
yale buy on dips confidence

World stocks are underperforming. Yesterday, we showed that few stocks in the S&P 500 have been able to beat the index over a 12-month period. It's not just the U.S. - the same phenomenon can be seen worldwide. Source: Julien Bittel of Pictet
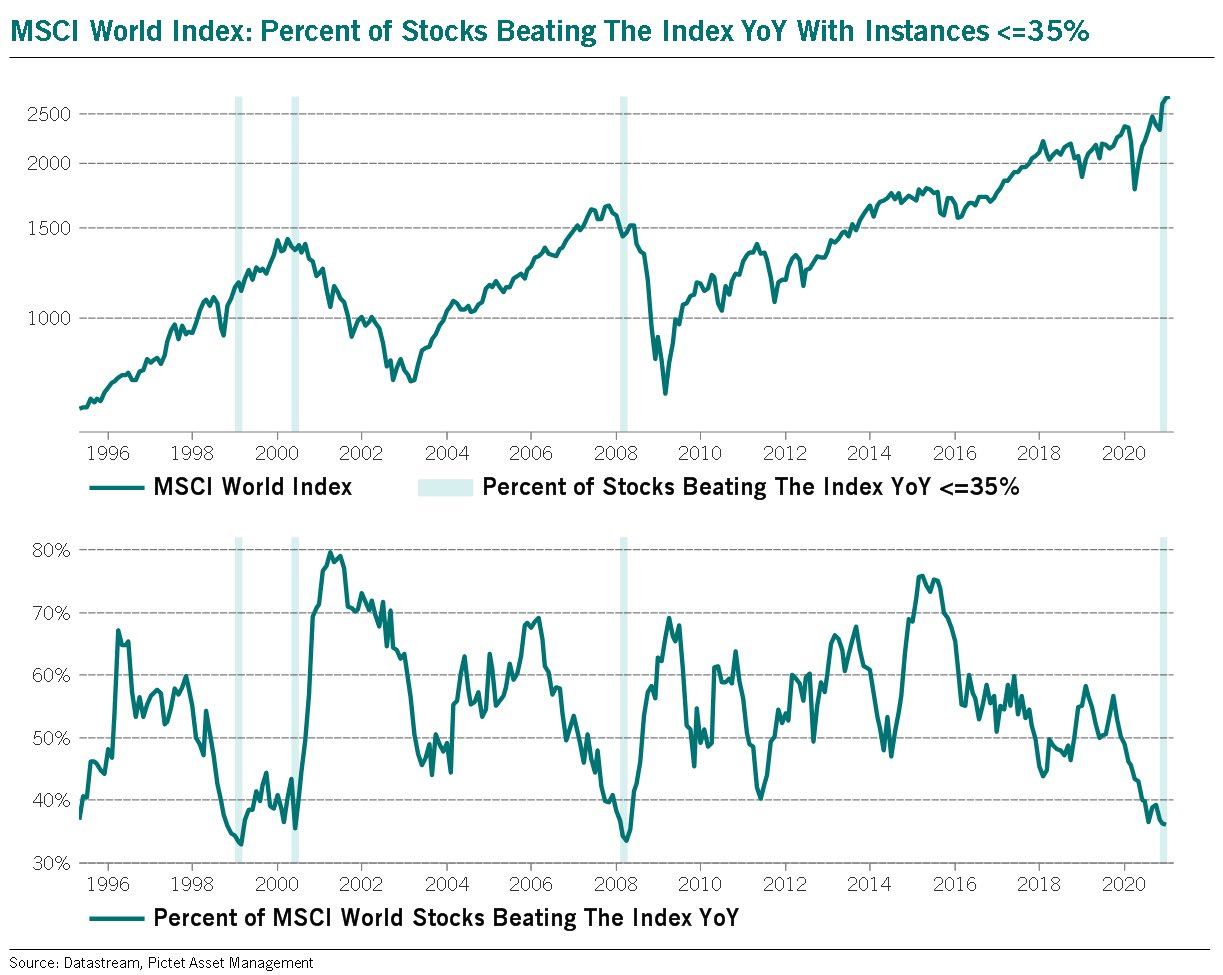
world stocks underperforming msci world index

Individuals are getting cautious, too. At least, if you want to believe that a relatively small sample of relatively old folks is an accurate measure of "sentiment." The AAII survey is showing a consistent leak in the percentage of bullish investors. Source: AAII via Helene Meisler
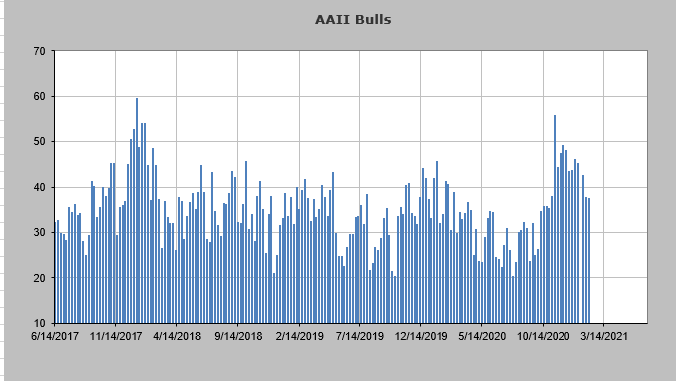
aaii bulls

DATA &
TECHnologies
IndicatorEdge
‍
BackTestEdge
‍
Other Tools
‍
DataEdge API
RESEARCH
reports
Research Solution
‍
Reports Library
‍
actionable
Strategies
Trading Strategies
‍
Smart Stock Scanner
‍
FREE
RESOUrCES
Simple Backtest
Calculator
Simple Seasonality
Calculator
The Kelly Criterion
Calculator
Sentiment Geo Map
‍
Public Research Reports
‍
Free Webinar
COMPANY
‍
About
‍
Meet our Team
‍
In the News
‍
Testimonials
‍
Client Success Stories
Pricing
Bundle pricing
‍
Announcements
‍
FAQ
© 2024 Sundial Capital Research Inc. All rights reserved.
Setsail Marketing
TermsPrivacyAffiliate Program
Risk Disclosure: Futures and forex trading contains substantial risk and is not for every investor. An investor could potentially lose all or more than the initial investment. Risk capital is money that can be lost without jeopardizing ones’ financial security or life style. Only risk capital should be used for trading and only those with sufficient risk capital should consider trading. Past performance is not necessarily indicative of future results.

Hypothetical Performance Disclosure: Hypothetical performance results have many inherent limitations, some of which are described below. No representation is being made that any account will or is likely to achieve profits or losses similar to those shown; in fact, there are frequently sharp differences between hypothetical performance results and the actual results subsequently achieved by any particular trading program. One of the limitations of hypothetical performance results is that they are generally prepared with the benefit of hindsight. In addition, hypothetical trading does not involve financial risk, and no hypothetical trading record can completely account for the impact of financial risk of actual trading. for example, the ability to withstand losses or to adhere to a particular trading program in spite of trading losses are material points which can also adversely affect actual trading results. There are numerous other factors related to the markets in general or to the implementation of any specific trading program which cannot be fully accounted for in the preparation of hypothetical performance results and all which can adversely affect trading results.

Testimonial Disclosure: Testimonials appearing on this website may not be representative of other clients or customers and is not a guarantee of future performance or success.