Products
SentimenTrader Trading Tools
‍
Backtest Engine
My Trading Toolkit
Correlation Analysis
Seasonality
Market Prediction
Indicators & Data API
‍
Proprietary Indicators & Charts
Market Data API
Strategies & Scanner
‍
50+ Trading Strategies
Smart Stock Scanner
Smart Option Scanner
Research Reports
‍
Research Solutions
Reports Library
Free Resources
Simple Backtest Calculator
Simple Seasonality Calculator
The Kelly Criterion Calculator
Sentiment Geo Map
Public Research Reports
Education
Sentiment Indicators
Technical Indicators
Pricing
Company
About
In the News
Testimonials
Client Success Stories
Contact
Log inLoginSign up
< BACK TO ALL REPORTS

Sentiment and Seasonality converge in retailing

Jay Kaeppel
2022-02-09
Fear and loathing regarding the retailing sector ran high during the January selloff. Most investors have adopted a negative view of the potential for this sector going forward based on assumptions of a slowing economy. But sentiment and seasonality appear to be painting a different picture.

Key Points

  • Investors abandoned retailing stocks in January
  • Conventional wisdom argues that rising rates will slow the economy, which will be bad for the retail sector
  • However, sentiment and seasonality make a different argument

XRT as a proxy for the retail sector

SPDR S&P Retail ETF (XRT) serves as an investment proxy for the retailing sector as a whole. In addition, XRT is not concentrated in just the biggest large-cap stocks (AMZN, WMT, etc.). The largest holding represents roughly 1.3% of the fund's assets, and the Top 10 holdings represent approximately 11.5% of the fund's assets.

The chart below (courtesy of StockCharts) displays the daily price action for XRT for the last year.

By itself, the chart above does not inspire great confidence. Many technical analysts will see this simply as a chart pattern that is "breaking down" with its longer-term moving averages beginning to roll over. And that view may turn out to be correct. However - as always in the markets - there is an "alternate point of view."
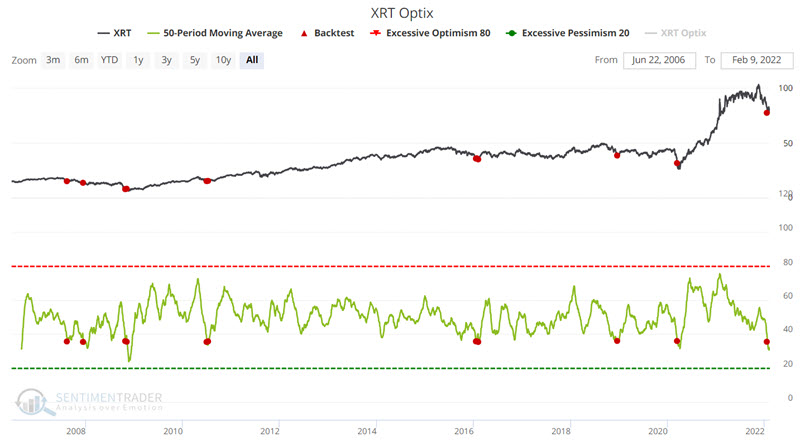
XRT Optix

The chart below displays those times when the 50-day moving average for XRT Optix crossed below 36. This typically occurs after XRT has suffered a decline and investors have thrown in the towel on retailing. The latest signal occurred on 1/21/2022. You can run this test in the Backtest Engine.

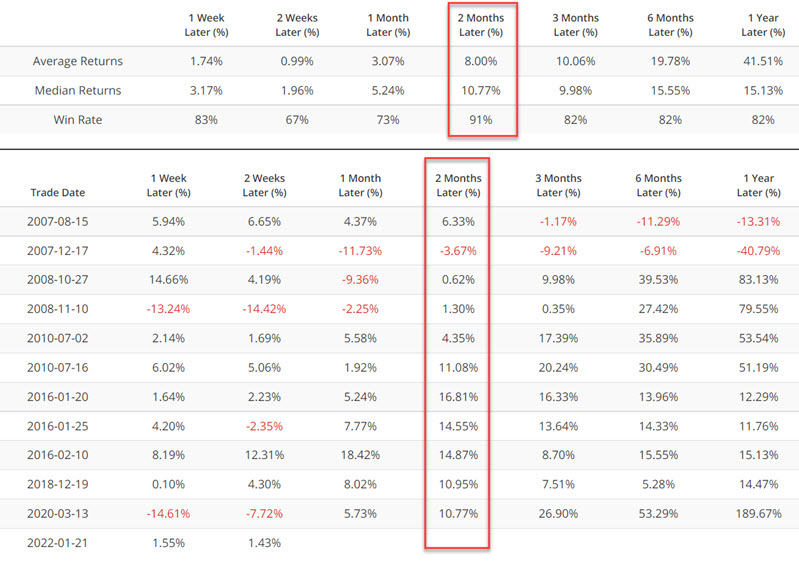
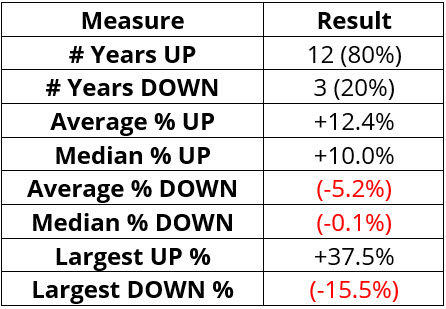
The table below displays a summary of XRT performance following previous signals. Of particular interest is the performance of XRT during the two months following a signal.
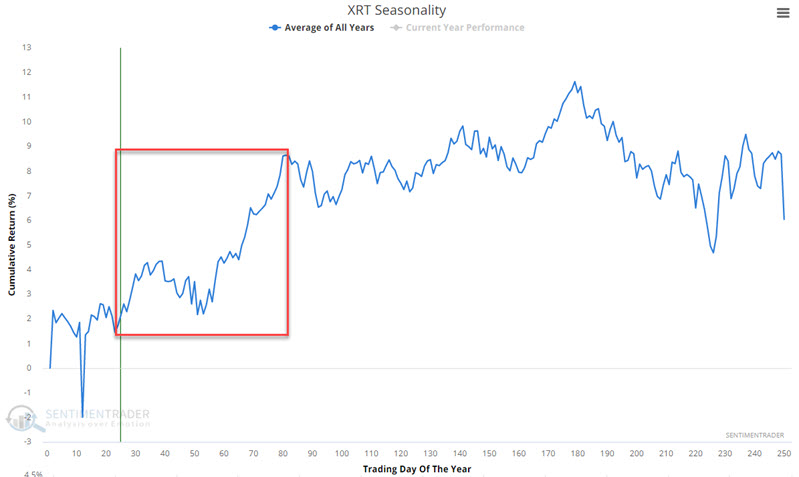
XRT Seasonality

The chart below displays the annual seasonal chart for XRT. Note the highlighted period of strength that extends from Trading Day of the Year (TDY) #23 through TDY #81. This period of seasonal strength began at the close on 2/3/2022 and extends through the close on 4/28/2022. 

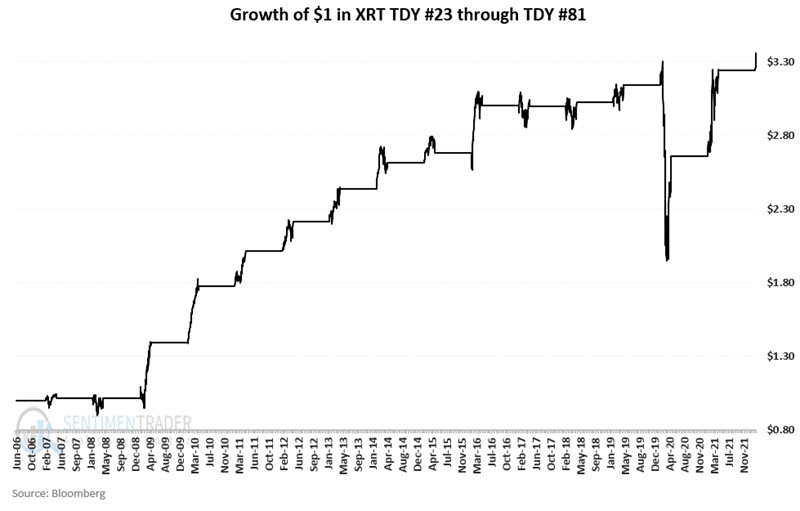
The chart below displays the growth of $1 invested in XRT only between TDY #23 and TDY #81 each year since XRT started trading. The Covid-panic selloff of 2020 was a black mark but also an aberration.

The table below displays a summary of XRT performance during this seasonally favorable period.

What the research tells us…

The conventional wisdom at the moment is something along the lines of, a) the Fed will raise rates and slow pumping money, b) as a result, the economy will slow, c) this confluence of actions will negatively impact retail sales, d) the retailing sector is in trouble.

It certainly sounds logical. But if there is one thing we have learned about conventional wisdom, it's that the market doesn't always pay attention. We have also learned that when sentiment and seasonality align, good things often - though notably, not always - follow.

PRODUCTS
SentimenTrader
Trading Tools
Indicators & Data API
‍
Strategies & Scanner
‍
Research Reports
FREE
RESOUrCES
Simple Backtest
Calculator
Simple Seasonality
Calculator
The Kelly Criterion
Calculator
Sentiment Geo Map
‍
Public Research Reports
‍
Education
Sentiment Indicators
‍
Technical Indicators
‍
Pricing
Bundle pricing
‍
FAQ
‍
Announcements
‍
COMPANY
‍
About
‍
In the News
‍
Testimonials
‍
Client Success Stories
CONTACT
‍
General Inquiries
‍
Media Inquiries
‍
Financial Professionals Inquiries
‍
© 2026 Sundial Capital Research Inc. All rights reserved.
Setsail Marketing
TermsPrivacyAffiliate Program
Risk Disclosure: The information and tools provided are for research and analytical purposes only and are not intended as investment advice. Market analysis involves uncertainty, and outcomes may differ from expectations. Users should conduct their own due diligence and consider their individual circumstances before making any financial decisions. Past performance is not necessarily indicative of future results.

Hypothetical Performance Disclosure: Hypothetical performance results have many inherent limitations, some of which are described below. No representation is being made that any account will or is likely to achieve profits or losses similar to those shown; in fact, there are frequently sharp differences between hypothetical performance results and the actual results subsequently achieved by any particular trading program. One of the limitations of hypothetical performance results is that they are generally prepared with the benefit of hindsight. In addition, hypothetical trading does not involve financial risk, and no hypothetical trading record can completely account for the impact of financial risk of actual trading. for example, the ability to withstand losses or to adhere to a particular trading program in spite of trading losses are material points which can also adversely affect actual trading results. There are numerous other factors related to the markets in general or to the implementation of any specific trading program which cannot be fully accounted for in the preparation of hypothetical performance results and all which can adversely affect trading results.

Testimonial Disclosure: Testimonials appearing on this website may not be representative of other clients or customers and is not a guarantee of future performance or success.