Data &
Technology
Research
Reports
Report Solutions
Reports Library
Actionable
Strategies
Free
Resources
Simple Backtest Calculator
Simple Seasonality Calculator
The Kelly Criterion Calculator
Sentiment Geo Map
Public Research Reports
Free Webinar
Pricing
Company
About
Meet Our Team
In the News
Testimonials
Client Success Stories
Contact
Log inLoginSign up
< BACK TO ALL REPORTS

Seasonality has soured

Jason Goepfert
2020-07-20
Stocks are now entering one of their worst seasonal stretches, with seasonal peaks in the S&P 500 and Nasdaq 100 occurring now. This is one of the few times of the year when the S&P 500's rolling two-month forward return has averaged worse than -1% since 1999.

According to Morgan Stanley (via the WSJ), stocks are about to enter a seasonally rough stretch.

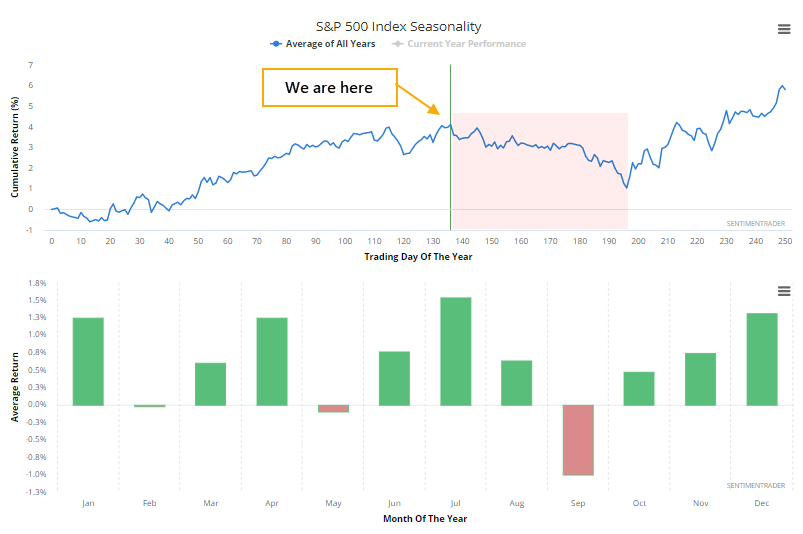
Indeed we are, based on seasonal calendar returns for the S&P 500. Seasonality in stocks is a tertiary factor even at its best and carries very little weight. It's still a headwind, though.

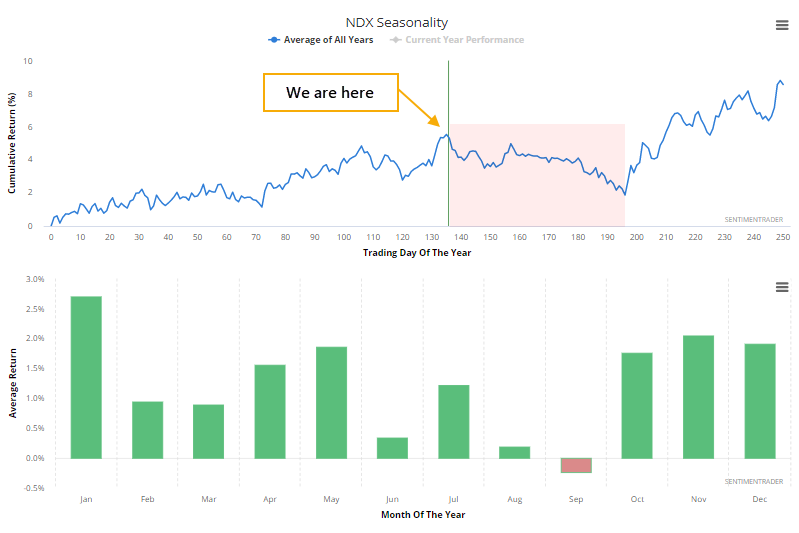
It's even worse for indexes like the Nasdaq 100, whose component stocks have helped to drive this rally. The NDX's seasonal peak is right now.

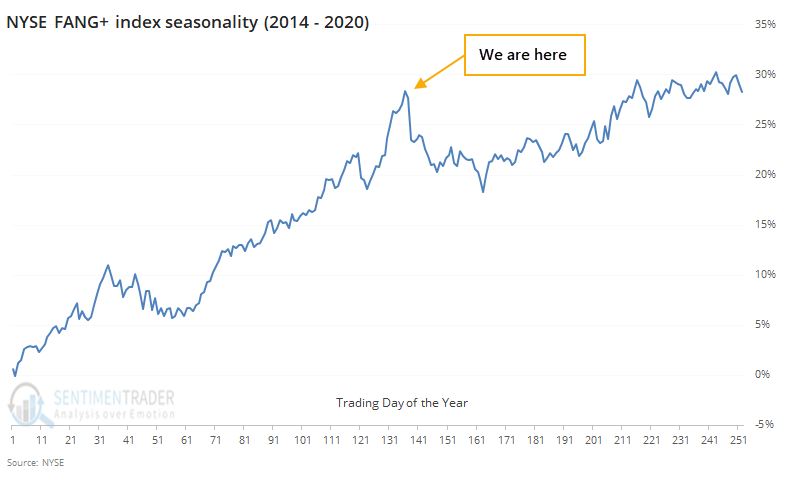
When focusing on just the main drivers, which are primarily the FANG stocks, we can see from the abbreviated history of the NYSE FANG+ index that even during the powerful trend over the past five or so years, those stocks have tended to take a breather right about now.

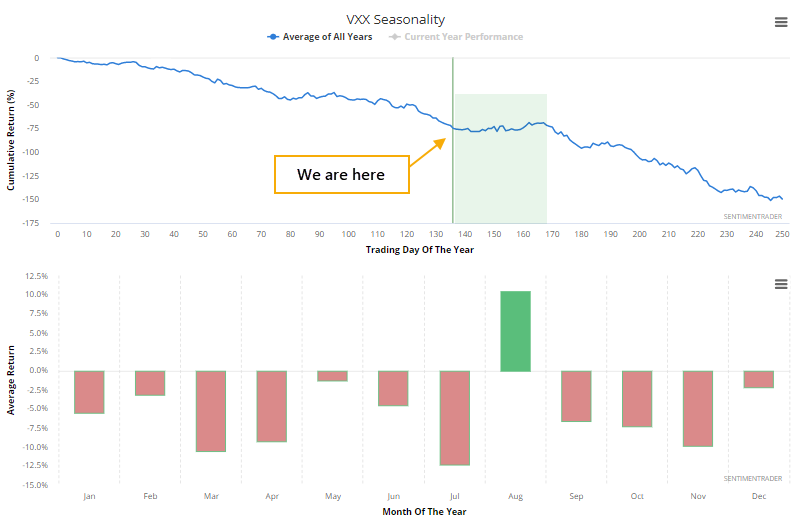
It's the same pattern if we look at ETFs for other indexes like DIA and IWM. Because riskier assets like stocks have stumbled right about now, funds like VXX have rallied, even though its long-term trend is almost relentlessly negative.

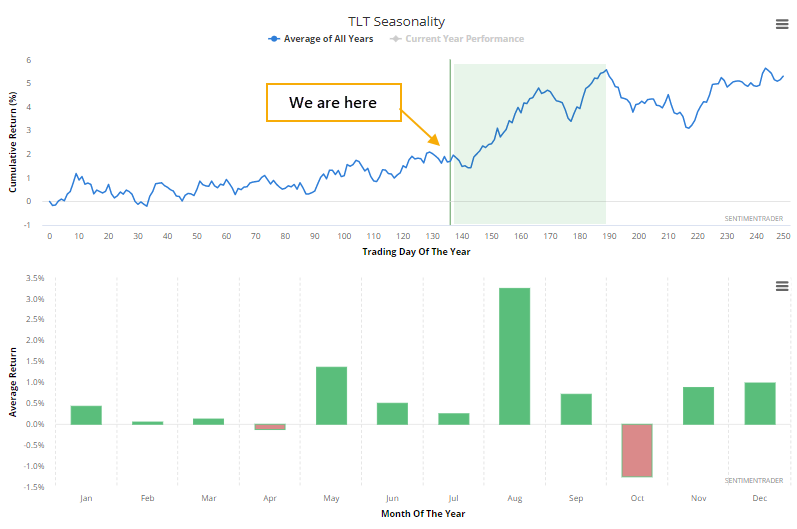
While there are some negatives right now for bonds, the summer seasonal swoon in stocks proved to usually be a tailwind for TLT.

If we use the Morgan Stanley methodology to look at the S&P 500's forward rolling 2-month returns since 1999, then we can see a similar pattern, with the biggest dip occurring right about now.

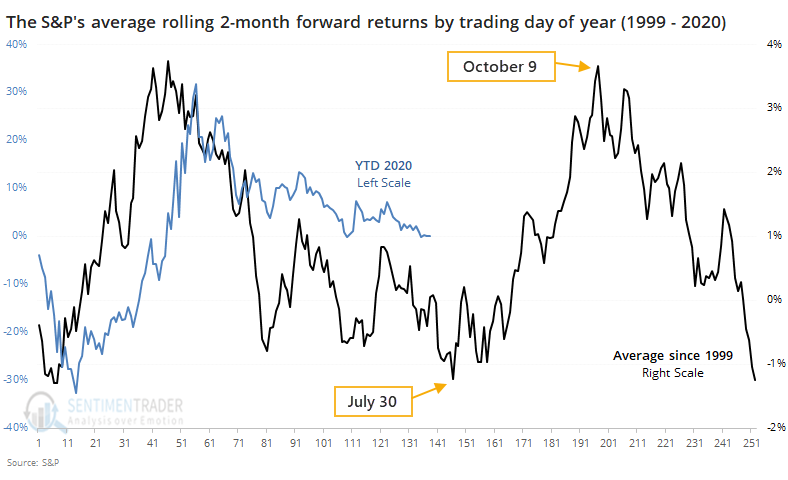
What the black line on the chart shows us is the S&P's average two-month return over the next two months for every trading day of the year. We're at trading day #138 as of Monday, with late July being one of the very few windows where the S&P's average forward return is more than -1%. Contrast that to early October, when its average two-month return has been more than +3.5%.

Seasonality in stocks is a tertiary consideration at best, so we wouldn't weight this heavily. Still, it's a minor headwind as we head into the late summer.

DATA &
TECHnologies
IndicatorEdge
‍
BackTestEdge
‍
Other Tools
‍
DataEdge API
RESEARCH
reports
Research Solution
‍
Reports Library
‍
actionable
Strategies
Trading Strategies
‍
Smart Stock Scanner
‍
FREE
RESOUrCES
Simple Backtest
Calculator
Simple Seasonality
Calculator
The Kelly Criterion
Calculator
Sentiment Geo Map
‍
Public Research Reports
‍
Free Webinar
COMPANY
‍
About
‍
Meet our Team
‍
In the News
‍
Testimonials
‍
Client Success Stories
Pricing
Bundle pricing
‍
Announcements
‍
FAQ
© 2024 Sundial Capital Research Inc. All rights reserved.
Setsail Marketing
TermsPrivacyAffiliate Program
Risk Disclosure: Futures and forex trading contains substantial risk and is not for every investor. An investor could potentially lose all or more than the initial investment. Risk capital is money that can be lost without jeopardizing ones’ financial security or life style. Only risk capital should be used for trading and only those with sufficient risk capital should consider trading. Past performance is not necessarily indicative of future results.

Hypothetical Performance Disclosure: Hypothetical performance results have many inherent limitations, some of which are described below. No representation is being made that any account will or is likely to achieve profits or losses similar to those shown; in fact, there are frequently sharp differences between hypothetical performance results and the actual results subsequently achieved by any particular trading program. One of the limitations of hypothetical performance results is that they are generally prepared with the benefit of hindsight. In addition, hypothetical trading does not involve financial risk, and no hypothetical trading record can completely account for the impact of financial risk of actual trading. for example, the ability to withstand losses or to adhere to a particular trading program in spite of trading losses are material points which can also adversely affect actual trading results. There are numerous other factors related to the markets in general or to the implementation of any specific trading program which cannot be fully accounted for in the preparation of hypothetical performance results and all which can adversely affect trading results.

Testimonial Disclosure: Testimonials appearing on this website may not be representative of other clients or customers and is not a guarantee of future performance or success.