Data &
Technology
Research
Reports
Report Solutions
Reports Library
Actionable
Strategies
Free
Resources
Simple Backtest Calculator
Simple Seasonality Calculator
The Kelly Criterion Calculator
Sentiment Geo Map
Public Research Reports
Free Webinar
Pricing
Company
About
Meet Our Team
In the News
Testimonials
Client Success Stories
Contact
Log inLoginSign up
< BACK TO ALL REPORTS

Retail traders rush to buy protection as Dumb Money Confidence craters

Jason Goepfert
2022-03-01
Retail options traders are paying up for hedges as they buy put protection. Dumb Money Confidence in a stock market rally has cratered.

Retail options traders rush for protection

Last week's reversal was one for the record books. While reversals always look impressive on a chart, generating a bevy of excited chatter and headlines, they are unreliable patterns. And retail traders aren't buying into the hype.

Two weeks ago, small options traders spent a tremendous amount of their volume on protective put options. They took a mild break after markets initially rebounded but now are at it again. Last week, they spent 29% of their volume on buying put options to open, among the highest levels in 22 years. 

Last week, the smallest of options traders bought $4.3 billion worth of put options and $4.5 billion worth of call options. So, their spending on hedges was 96% of their spending on speculation, one of the highest ratios in 22 years.Small options traders are paying up for put options

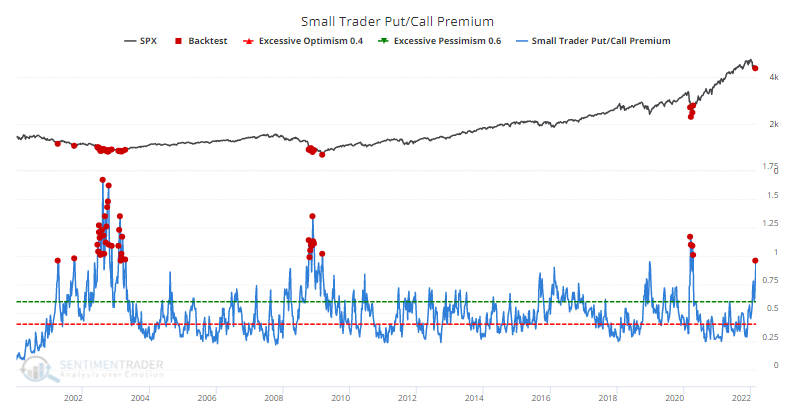
Our Backtest Engine shows only modestly positive medium-term returns but excellent long-term ones. That's because this kind of behavior only occurred during the depths of the worst declines of the past two decades.

Stat box

Over the past 5 days, traders have put an average of $525 million per day into the LQD corporate bond fund. Outside of volatile swings during the pandemic, this is the largest 5-day inflow in the fund's history.


Dumb Money Confidence plummets

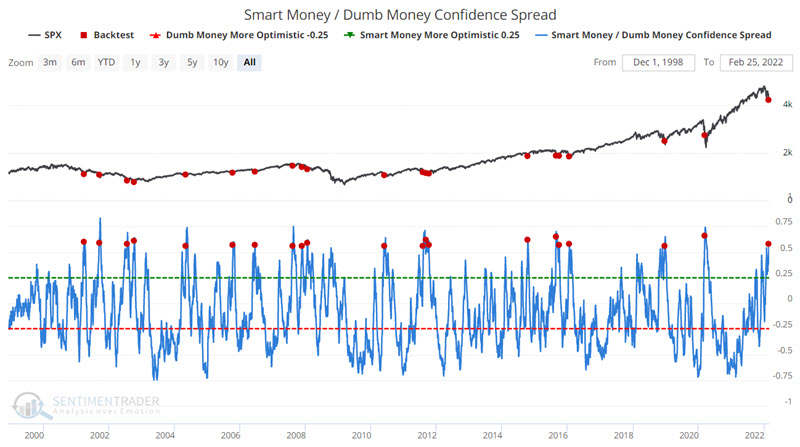
Jay noted that Dumb Money Confidence in a stock market rally has plunged, while Smart Money Confidence remains relatively high.

The chart below displays those days when the Smart Money / Dumb Money Confidence Spread crossed above 55 for the first time in a month. You can run this test in our Backtest Engine.

Smart money and dumb money confidence hits an extreme

Let's consider the following approach to using these signals:

  • Each time the spread exceeds 55 for the first time in a month, we will hold the S&P 500 Index for 42 trading days.
  • If a new signal occurs while an existing signal is active, the holding period is extended for another 42 trading days.
  • So, if only one signal occurs, the holding period will be 42 trading days (i.e., roughly two months); If there are overlapping signals, the holding period will be longer.

Of the previous signals, 15 of 16 (94%) have shown a gain, averaging 6.9%.

DATA &
TECHnologies
IndicatorEdge
‍
BackTestEdge
‍
Other Tools
‍
DataEdge API
RESEARCH
reports
Research Solution
‍
Reports Library
‍
actionable
Strategies
Trading Strategies
‍
Smart Stock Scanner
‍
FREE
RESOUrCES
Simple Backtest
Calculator
Simple Seasonality
Calculator
The Kelly Criterion
Calculator
Sentiment Geo Map
‍
Public Research Reports
‍
Free Webinar
COMPANY
‍
About
‍
Meet our Team
‍
In the News
‍
Testimonials
‍
Client Success Stories
Pricing
Bundle pricing
‍
Announcements
‍
FAQ
© 2024 Sundial Capital Research Inc. All rights reserved.
Setsail Marketing
TermsPrivacyAffiliate Program
Risk Disclosure: Futures and forex trading contains substantial risk and is not for every investor. An investor could potentially lose all or more than the initial investment. Risk capital is money that can be lost without jeopardizing ones’ financial security or life style. Only risk capital should be used for trading and only those with sufficient risk capital should consider trading. Past performance is not necessarily indicative of future results.

Hypothetical Performance Disclosure: Hypothetical performance results have many inherent limitations, some of which are described below. No representation is being made that any account will or is likely to achieve profits or losses similar to those shown; in fact, there are frequently sharp differences between hypothetical performance results and the actual results subsequently achieved by any particular trading program. One of the limitations of hypothetical performance results is that they are generally prepared with the benefit of hindsight. In addition, hypothetical trading does not involve financial risk, and no hypothetical trading record can completely account for the impact of financial risk of actual trading. for example, the ability to withstand losses or to adhere to a particular trading program in spite of trading losses are material points which can also adversely affect actual trading results. There are numerous other factors related to the markets in general or to the implementation of any specific trading program which cannot be fully accounted for in the preparation of hypothetical performance results and all which can adversely affect trading results.

Testimonial Disclosure: Testimonials appearing on this website may not be representative of other clients or customers and is not a guarantee of future performance or success.