
Percentage of members above the 50-day average risk-off signal

In light of the new momentum buy signal for the percentage of members above the 50-day moving average, I thought I would share how I use the same time series to identify a risk-off environment. If forced to choose one duration for the percentage of members above a moving average, the 50-day calculation would be my choice as it reacts to changing market dynamics in a manner that suits my investing style.
Percentage of Members above the 50-Day Moving Average Risk-Off Components
Percentage of S&P 500 members above their respective 50-day moving average
Percentage of Members above the 50-Day Moving Average Risk-Off Model
The percentage of members above the 50-Day moving average risk-off model seeks to identify instances in history when a low number of Index members are trading above their respective 50-day average as the Index hovers near a high. The model will issue two separate alerts based upon the following conditions.
Signal 1
Condition1 = Percentage of S&P 500 members <= 65%
Condition2 = S&P 500 Index <= 0.25% from 252-Day High
Condition3 = If Condition 1 & 2, start a days since true count
Condition4 = If days since true count <= ten days and the percentage of S&P 500 members crosses below 50%, signal risk-off.
Condition5 = If percentage of members crosses above 66%, reset condition = true.
Signal 2
Condition1 = Percentage of S&P 500 members <= 54.5%
Condition2 = S&P 500 Index <= 0.25% from 252-day high
Condition3 = If Condition 1 & 2, start a days since true count
Condition4 = If days since true count <= ten days and the S&P 500 5-day rate of change is >= -1%, signal risk-off.
Condition5 = If percentage of members crosses above 63%, reset condition = true.
Let's take a look at some charts and the historical signal performance.
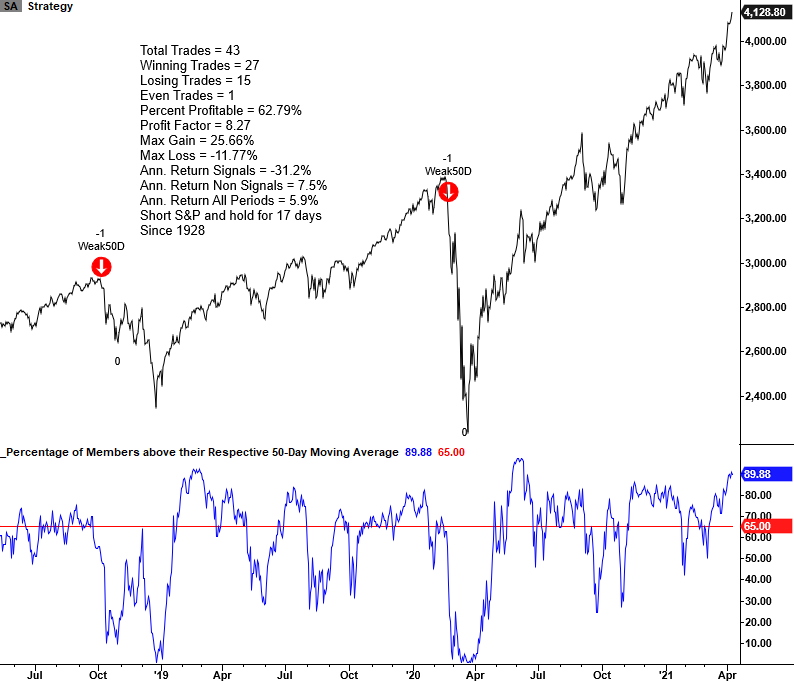
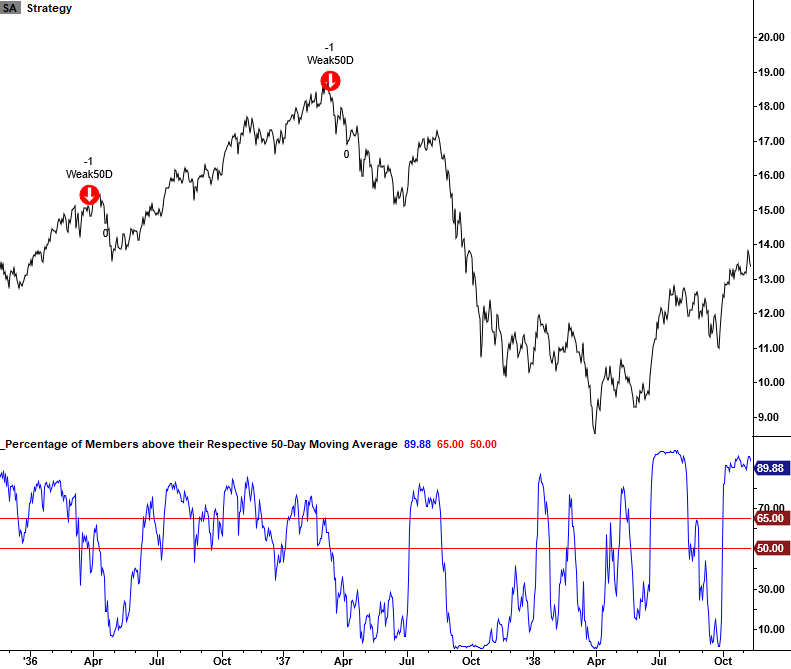
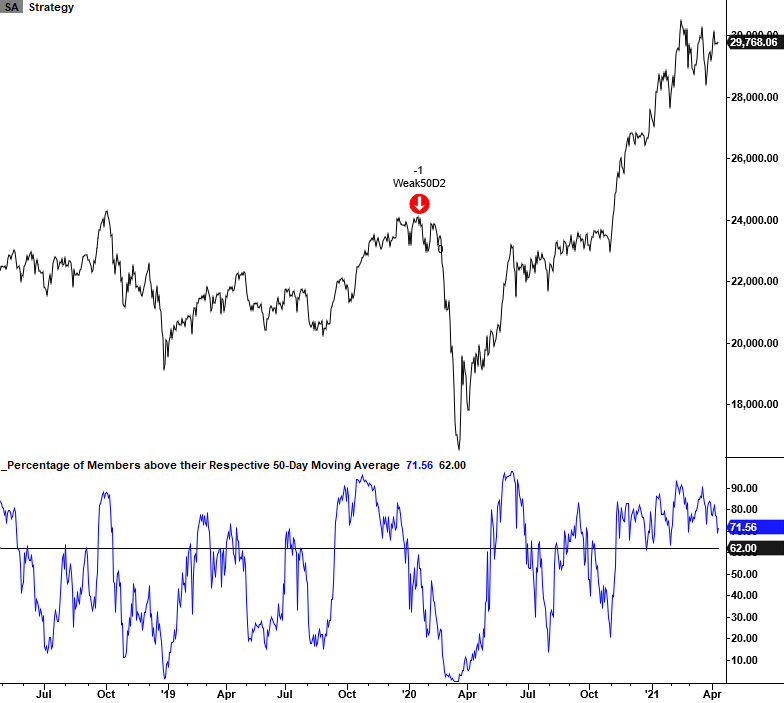
Current Day Chart
Please note, I calculate performance statistics in the chart as a short signal, whereas annualized returns result from buying the S&P 500.
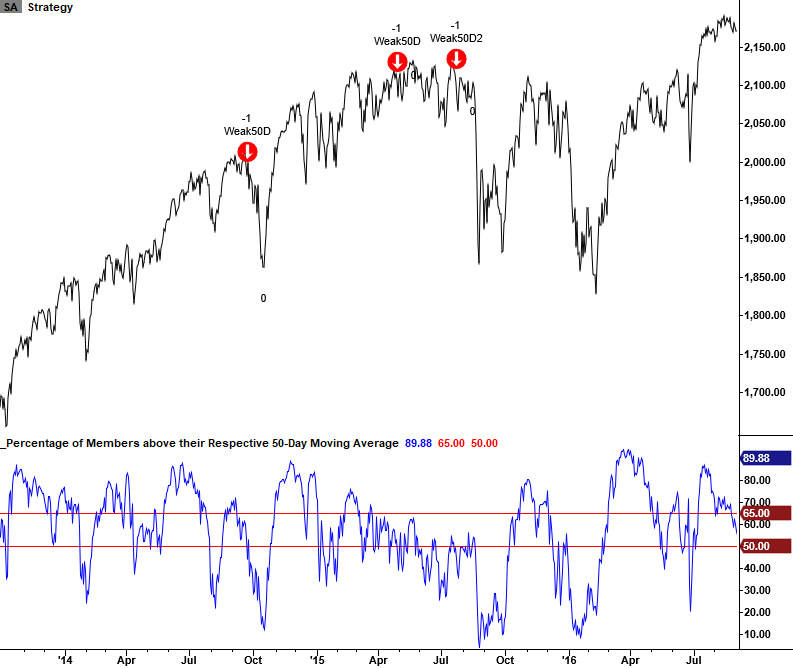
2015-2016 Oil/Commodity Bear
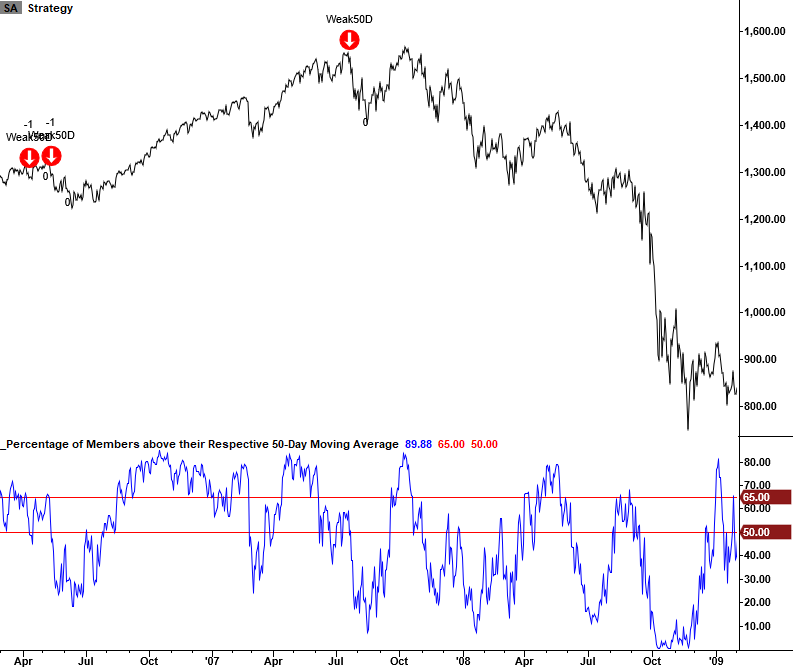
2007-08 Financial Crisis
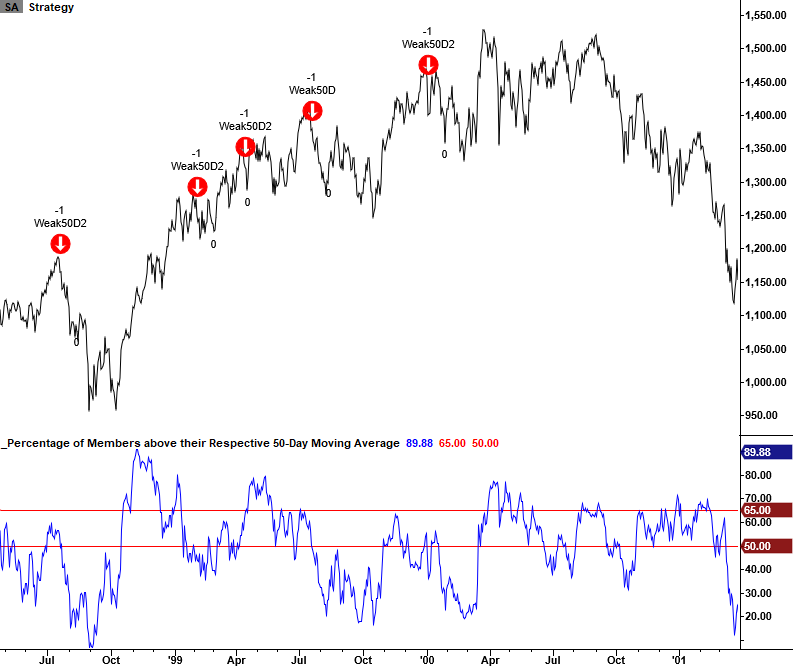
1998 LTCM and Internet Bubble
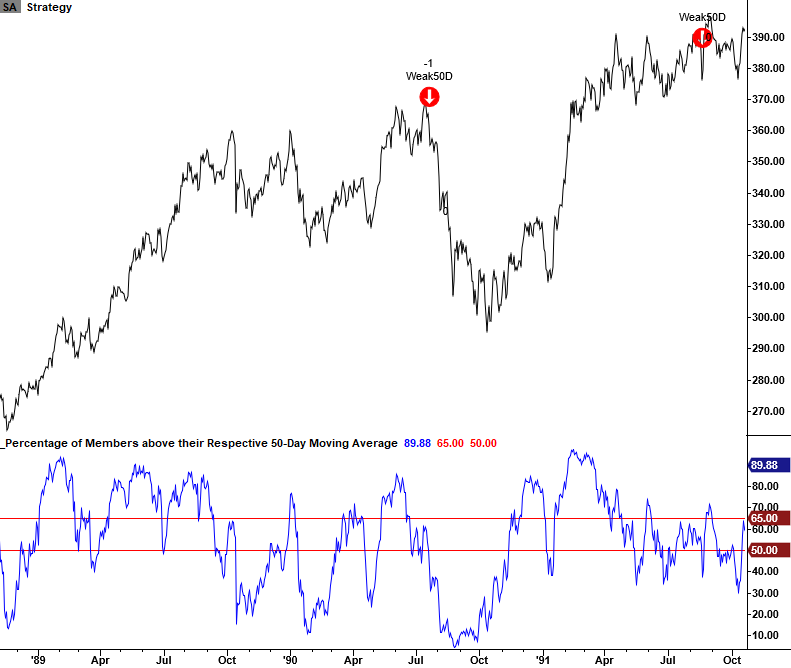
1990 Savings & Loan/Iraq Oil Spike
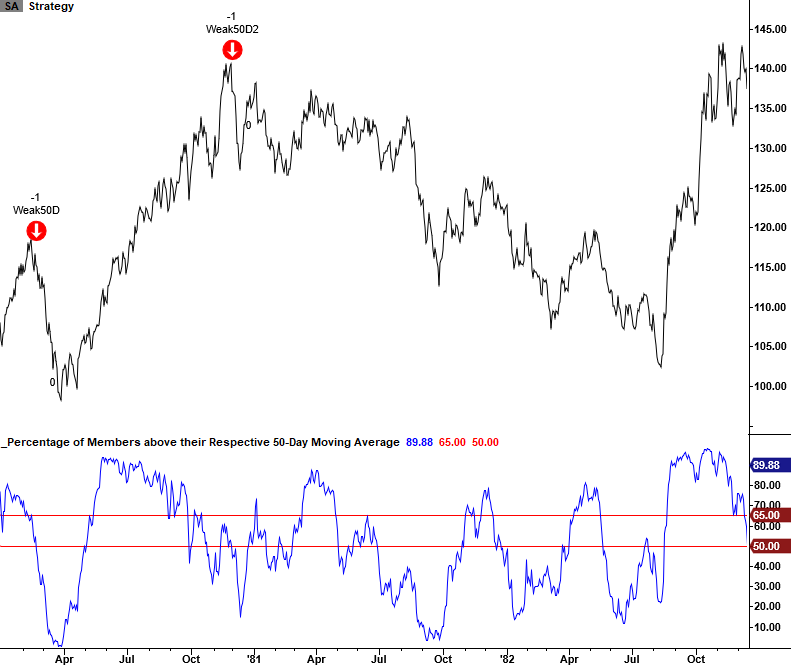
1980 Oil/Commodity Bubble
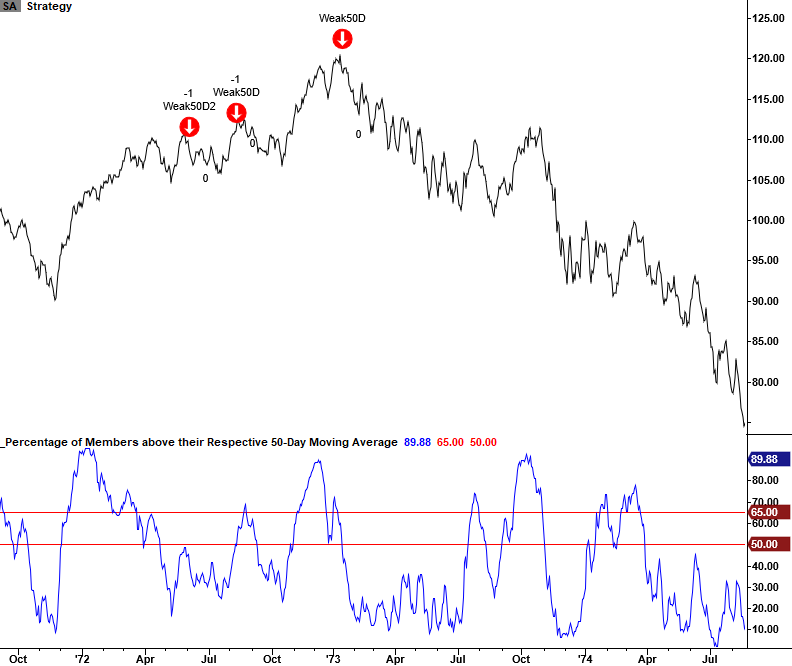
1973-74 Bretton Woods/Nixon Shock/Oil Embargo
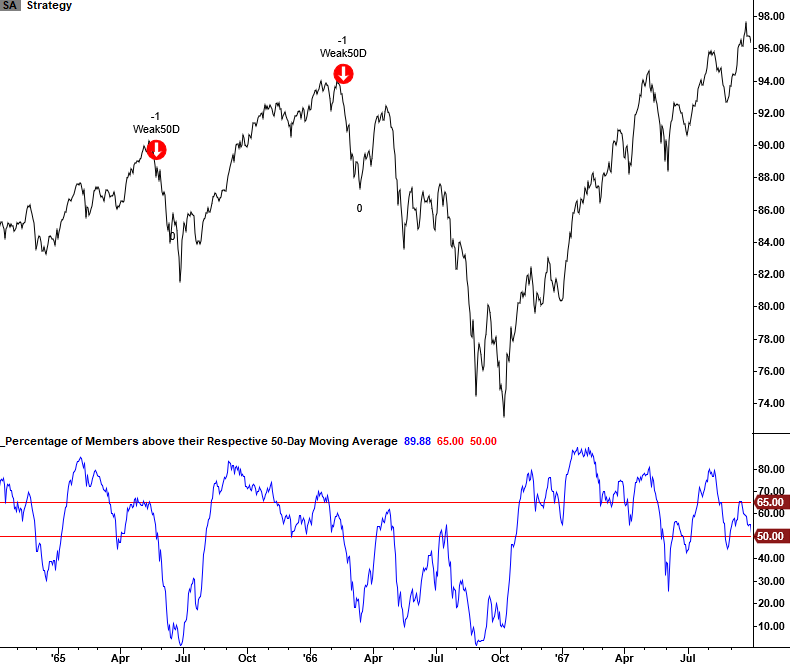
1966 Bear Market
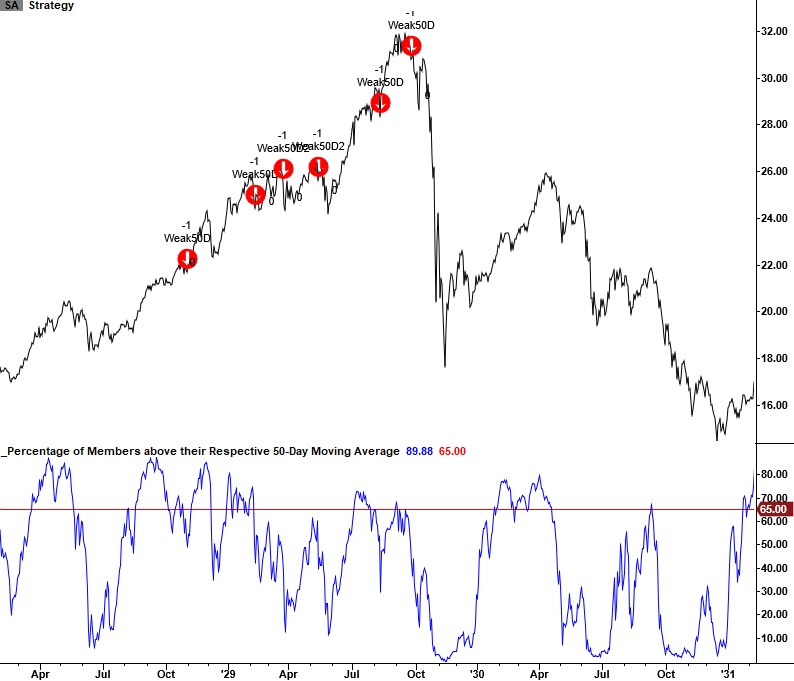
1937-38 Bear Market
1929-32 Bear Market
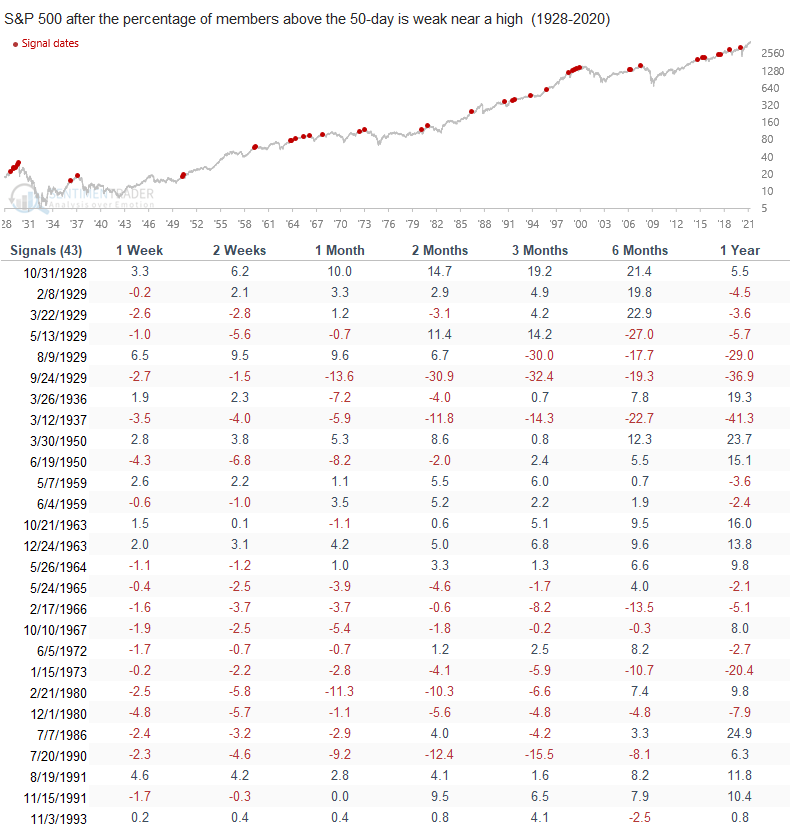
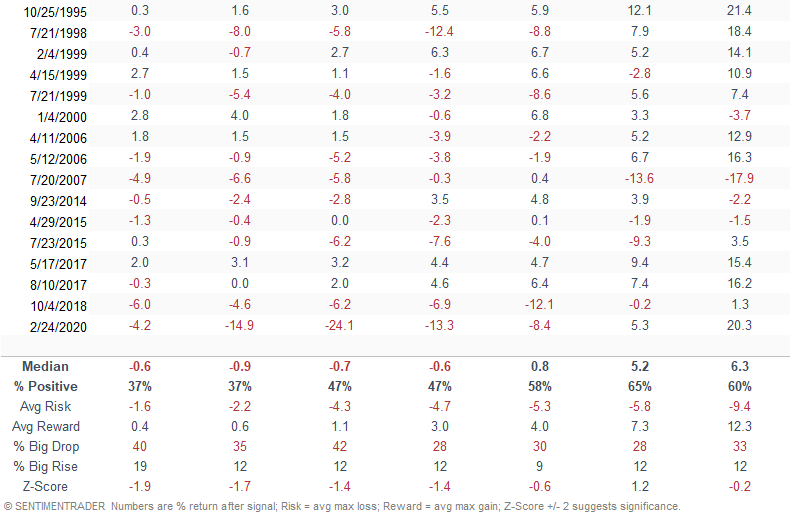
Signal Performance
As one can see, performance is weak in the 1-8 week timeframe, with several z-scores approaching the significant level of two. I would also add that the model utilizes a days-in-trade and indicator above stop level for exits. The failsafe level for the S&P 500 model is 69.5%, and it has only triggered four times in history. i.e., the DIT exit occurs in most instances as the indicator does not improve to a level that would trigger the stop.
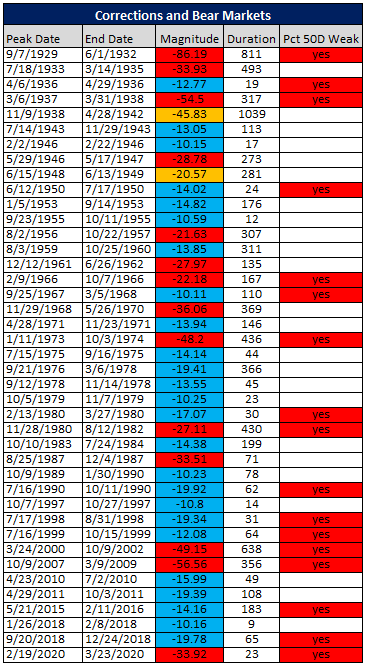
Historical Correction and Bear Market Table
The following table provides a historical signal perspective for the percentage of members above the 50-day average risk-off signal. A "yes" in the last column indicates that a signal triggered either before or just after a significant correction or bear market peak.
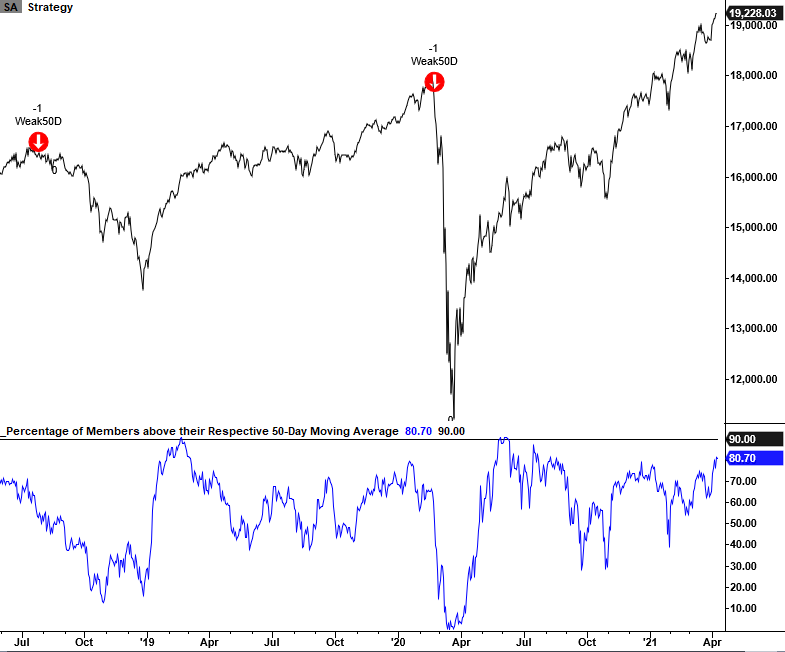
International Signals
I included a couple of international markets to show that the concept works on a global index basis.
Japan - Nikkei 225 Index
Canada - S&P/Toronto Stock Exchange
Conclusion: As the historical correction and bear market table shows, the percentage of members above the 50-day average has triggered ahead of several major market peaks. I would always use the signal in conjunction with other risk-off models as a weight-of-the-evidence approach provides a more favorable outcome. Given the current level, I would not expect an alert in the near term.