
Percentage of Financial Sector Member Lows Risk-Off Model

In my note on Tuesday, I shared my financials relative strength low count model for identifying risk-off periods as the Archegos Capital turmoil was causing a risk-off event in several banks with a prime broker division associated with the fund. The model is one of ten components in the TCTM Risk Warning Model. Today, I want to share another TCTM Risk Warning Model that utilizes financial sector data as an input.
Components
- # of 63 Day Lows for S&P 500 Financial Members
- # of 63 Day Lows for S&P 500 Members
- % of 63 Day Lows for S&P 500 Financial Members
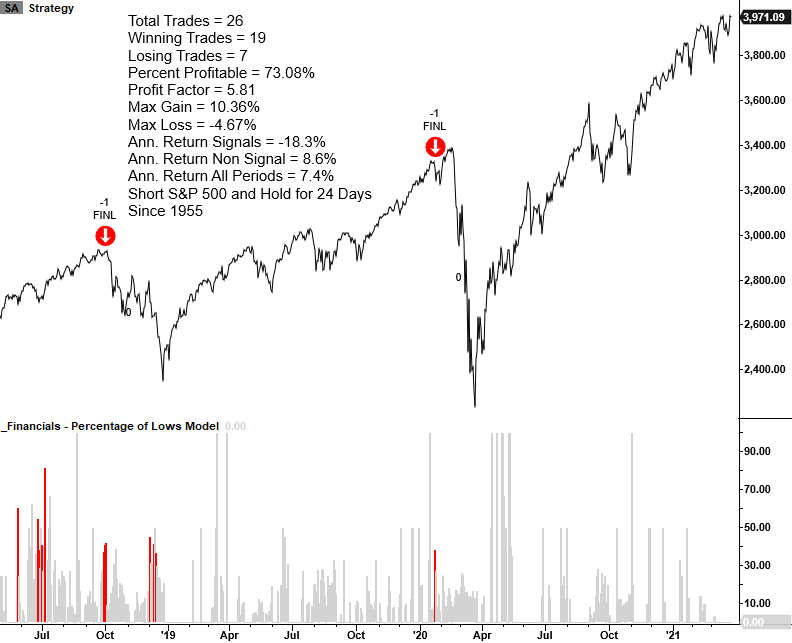
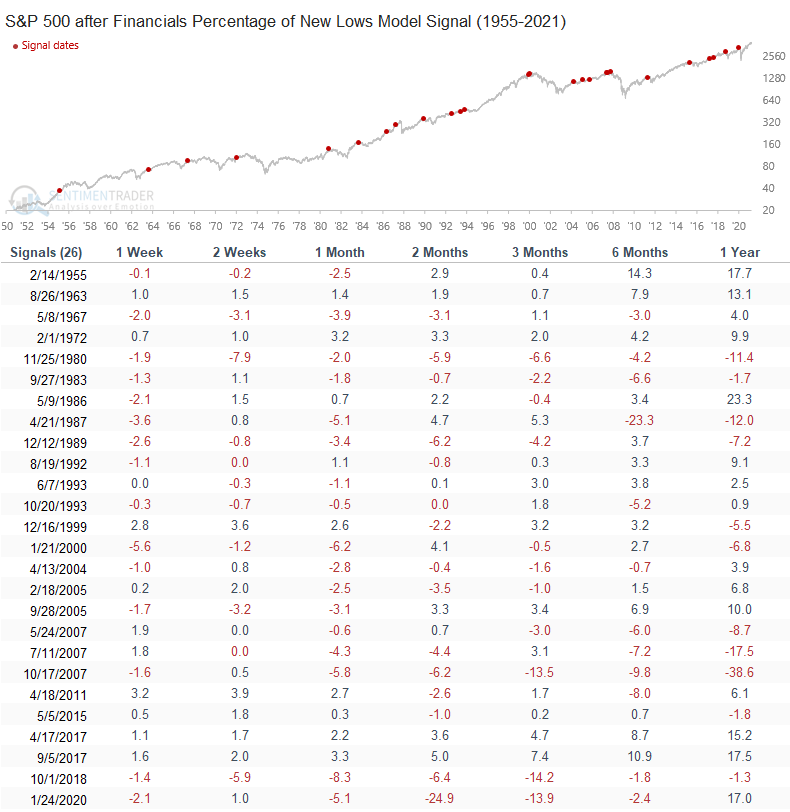
Percentage of Financial Sector Member Lows Model
The percentage of financial sector member lows model seeks to identify instances in history when financial sector member lows as a percentage of total S&P 500 lows surges above a user-defined level as overall financial lows are high. The model will issue an alert based upon the following conditions.
Signal Criteria
Condition1 = S&P 500 Financial 63-Day Lows as a Percentage of Total S&P 500 63-Day Lows >= 38%. i.e., financials dominate the new low list.
Condition2 = Percentage of S&P 500 Financials Lows >= 12.0%. i.e., the percentage within the sector
Condition3 = S&P 500 Index <= 3.0% from 500-Day High
If Condition 1-3 = true, reduce market exposure.
Please note, I do monitor the same model with 252-day lows. However, the 63-day low input produces better results.
Let's take a look at some charts and the historical signal performance.
Percentage of Financial Sector Member Lows Model Current Day
Please note, I calculate performance statistics in the chart as a short signal, whereas annualized returns result from buying the S&P 500.
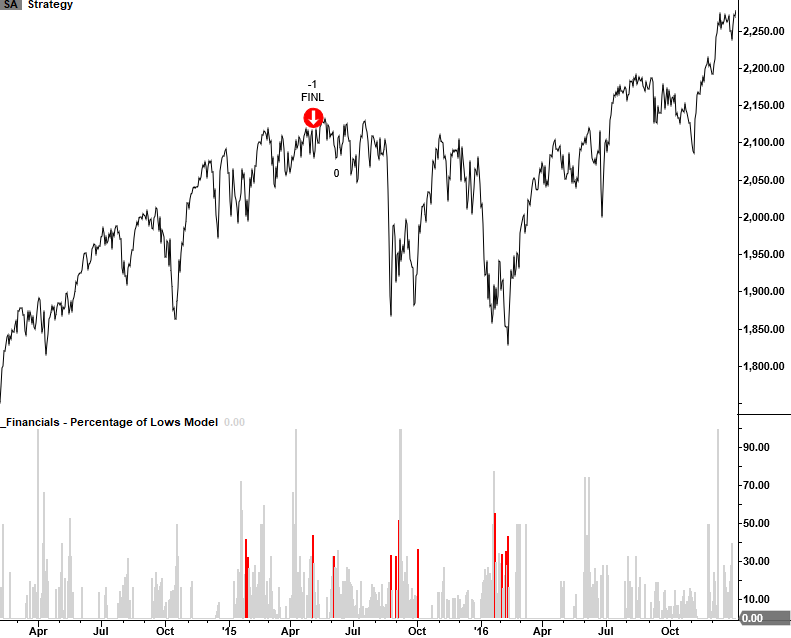
2015/16 Oil Crash
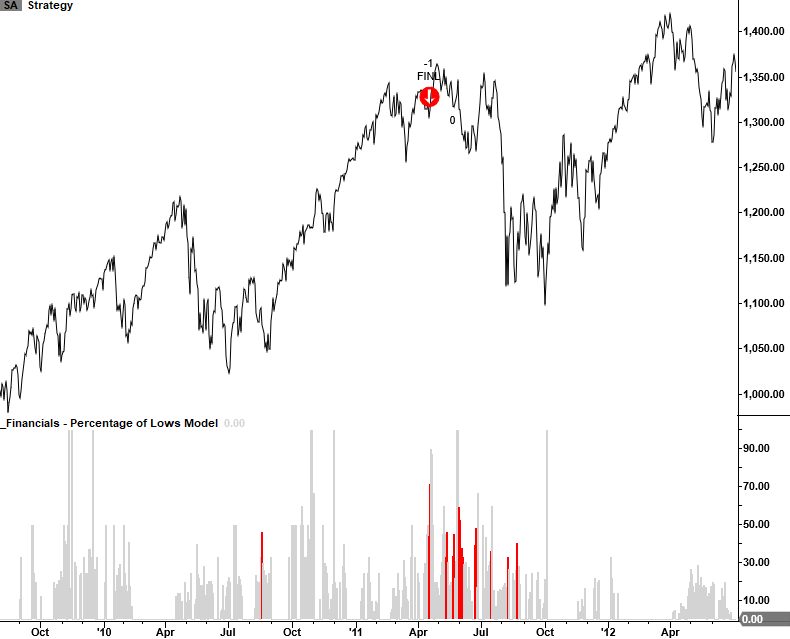
2011 Eurozone Debt Crisis
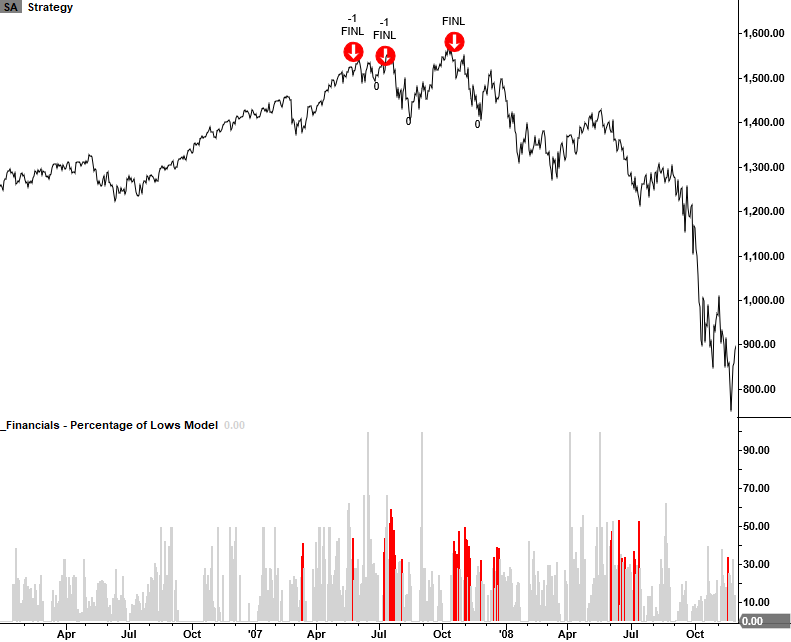
2007-08 Financial Crisis
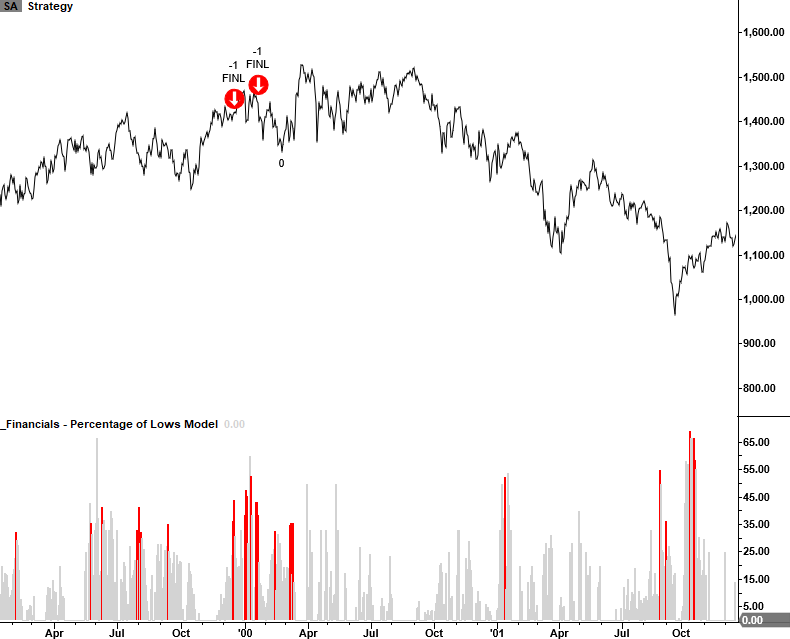
2000 Internet Bubble
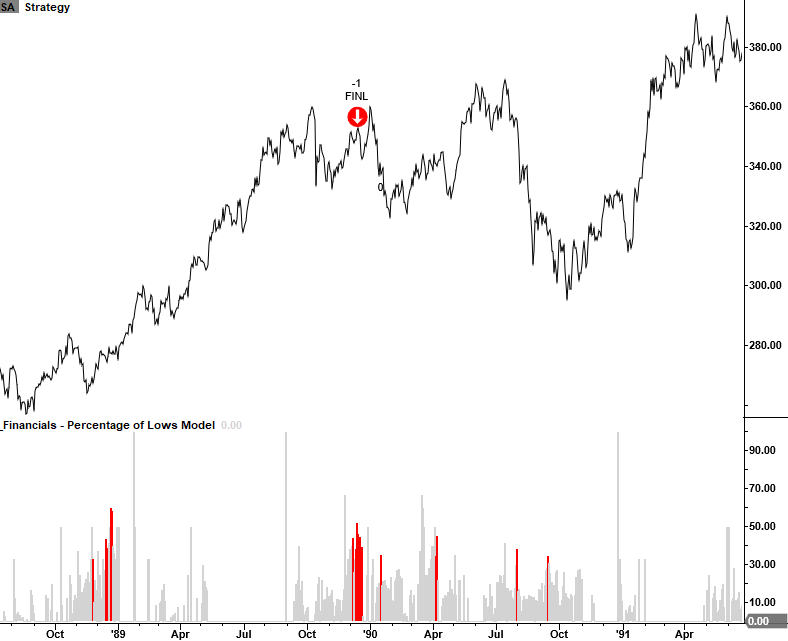
1990 Savings & Loan Crisis
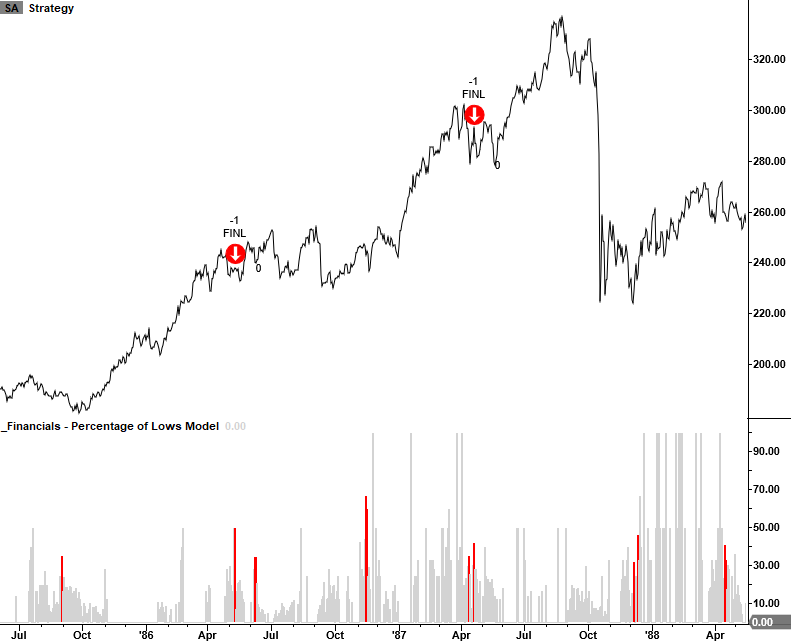
1987 Market Crash
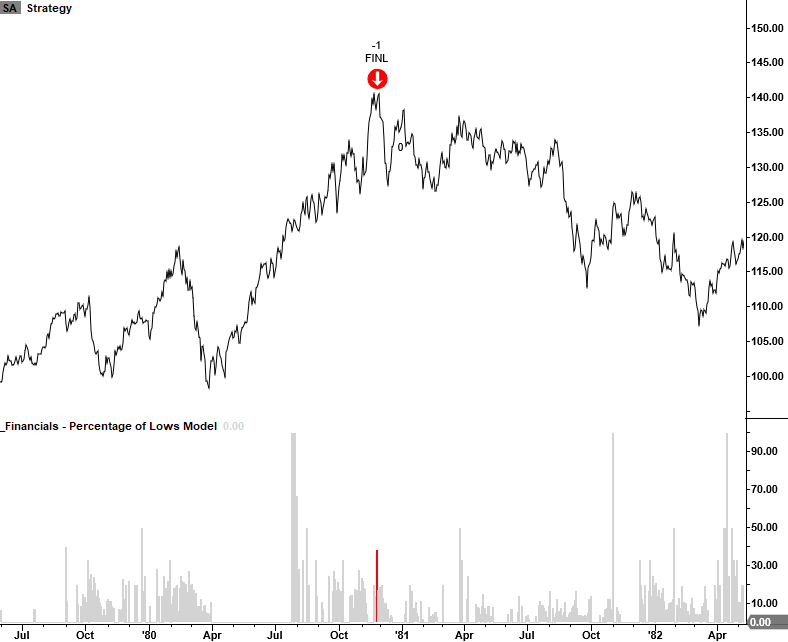
1980 Energy/Commodity Bubble
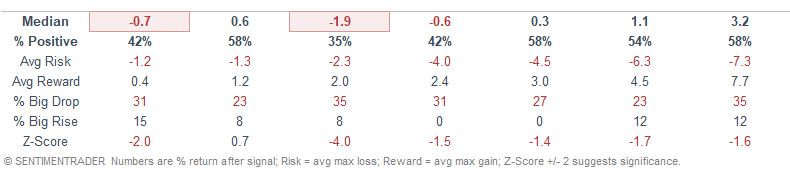
Signal Performance
As one can see, performance is weak across all timeframes with a notable z-score in the 1-month forward period.
 Conclusion: Financials are undoubtedly the most vitally important sector when it comes to identifying market risk. While the group does not have to lead the market, I don't want to see it underperform in a manner that would produce a high percentage of new lows as a percentage of total lows. As of now, financials look fine.