Products
SentimenTrader Trading Tools
‍
Backtest Engine
My Trading Toolkit
Correlation Analysis
Seasonality
Indicators & Data API
‍
Proprietary Indicators & Charts
Market Data API
Strategies & Scanner
‍
50+ Trading Strategies
Smart Stock Scanner
Research Reports
‍
Research Solutions
Reports Library
Free Resources
Simple Backtest Calculator
Simple Seasonality Calculator
The Kelly Criterion Calculator
Sentiment Geo Map
Public Research Reports
Pricing
Company
About
In the News
Testimonials
Client Success Stories
Contact
Log inLoginSign up
< BACK TO ALL REPORTS

Over the past 2 weeks, another historic thrust

Jason Goepfert
2020-06-02
Over the past two weeks, an overwhelming number of issues on the NYSE have advanced. This kind of a broad-based rally, for this prolonged period, has led to consistently positive long-term returns. When we see it occur after an oversold reading as we have, it has a perfect record.

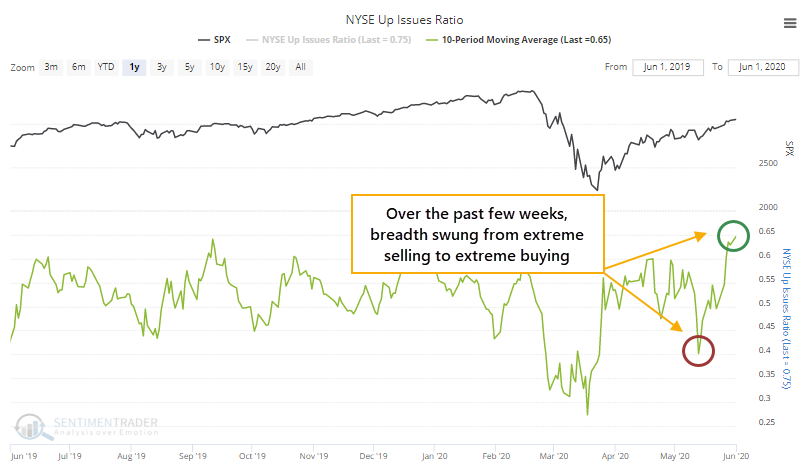
A little more than two weeks ago, the major stock indexes weren't showing much for losses, but underlying breadth was weak. The 10-day average of the NYSE Up Issues Ratio flirted with falling below the 40% threshold that suggests oversold conditions.

The rally since then has been dramatic, especially under the surface. An average day over the past two weeks has seen 65% of securities advance on the NYSE. That's a swift cycle from one extreme to the other.

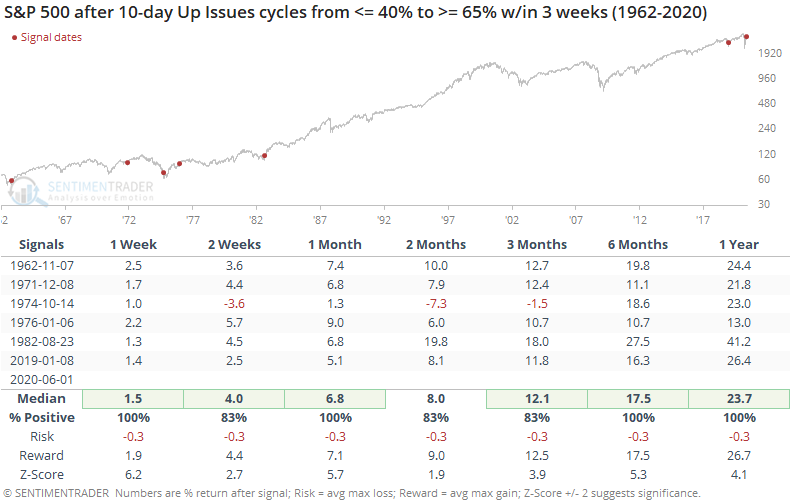
Like other breadth thrusts that we've discussed multiple times since late March, this has a very strong - perfect, in fact - tendency to lead to higher prices. It's especially pronounced over a 6-12 month time frame. The risk/reward is exceptionally positive.

If we ignore the oversold reading from a couple of weeks ago and just look at the current level, then it's on par with some of the most extreme readings in nearly 60 years.

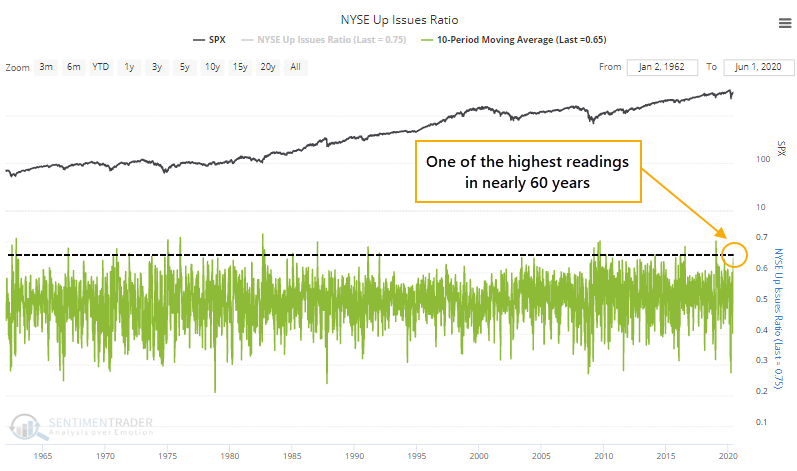
That simple fact has led to consistently impressive returns.

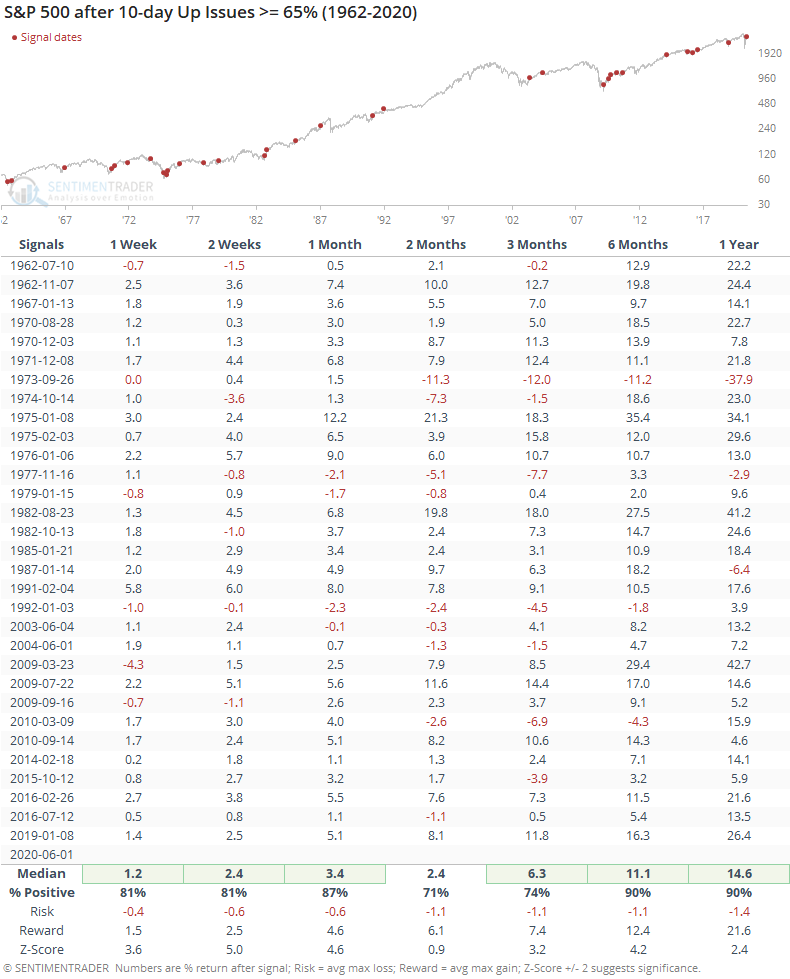
This kind of "overbought" thrust triggered in all kinds of market environments, and the context didn't really matter. When buying pressure was so great that it pushed an overwhelming number of stocks to rise over a multi-week period, it was a sign of a healthy long-term market. There were few losses over a 6-12 month time frame, and again the risk/reward was skewed heavily to the upside.

It's hard to reconcile developments like this versus some of the negatives that have popped up, especially the speculation among options traders. Those negatives are more focused on the shorter-term, while thrusts like this are more reliable on a longer-term basis. These thrusts have been the most compelling bullish argument for two months now and show no sign of slowing down.

Sorry, you don't have access to this report

Upgrade your subscription plan to get access
Go to Dasboard
PRODUCTS
SentimenTrader
Trading Tools
Indicators & Data API
‍
Strategies & Scanner
‍
Research Reports
FREE
RESOUrCES
Simple Backtest
Calculator
Simple Seasonality
Calculator
The Kelly Criterion
Calculator
Sentiment Geo Map
‍
Public Research Reports
‍
Pricing
Bundle pricing
‍
Announcements
‍
FAQ
COMPANY
‍
About
‍
In the News
‍
Testimonials
‍
Client Success Stories
CONTACT
‍
General Inquiries
‍
Media Inquiries
‍
Financial Professionals Inquiries
‍
© 2025 Sundial Capital Research Inc. All rights reserved.
Setsail Marketing
TermsPrivacyAffiliate Program
Risk Disclosure: Futures and forex trading contains substantial risk and is not for every investor. An investor could potentially lose all or more than the initial investment. Risk capital is money that can be lost without jeopardizing ones’ financial security or life style. Only risk capital should be used for trading and only those with sufficient risk capital should consider trading. Past performance is not necessarily indicative of future results.

Hypothetical Performance Disclosure: Hypothetical performance results have many inherent limitations, some of which are described below. No representation is being made that any account will or is likely to achieve profits or losses similar to those shown; in fact, there are frequently sharp differences between hypothetical performance results and the actual results subsequently achieved by any particular trading program. One of the limitations of hypothetical performance results is that they are generally prepared with the benefit of hindsight. In addition, hypothetical trading does not involve financial risk, and no hypothetical trading record can completely account for the impact of financial risk of actual trading. for example, the ability to withstand losses or to adhere to a particular trading program in spite of trading losses are material points which can also adversely affect actual trading results. There are numerous other factors related to the markets in general or to the implementation of any specific trading program which cannot be fully accounted for in the preparation of hypothetical performance results and all which can adversely affect trading results.

Testimonial Disclosure: Testimonials appearing on this website may not be representative of other clients or customers and is not a guarantee of future performance or success.