Indicators &
Backtest Tools
Research
Reports
Report Solutions
Reports Library
Strategies
& Scanner
Free
Resources
Simple Backtest Calculator
Simple Seasonality Calculator
The Kelly Criterion Calculator
Sentiment Geo Map
Public Research Reports
Free Webinar
Pricing
Company
About
Meet Our Team
In the News
Testimonials
Client Success Stories
Contact
Log inLoginSign up
< BACK TO ALL REPORTS

Options traders return to speculative euphoria

Jason Goepfert
2021-11-09
Speculative options trading has returned, nearing the prior peak from February.

Last week, we noted that options traders were quickly becoming more speculative. It hadn't reached the extremes from September 2020 or January/February 2021, but it was a stark change from the relative pessimism of just a little over a month ago.

Now, they're nearing the all-time speculative blow-off peak from February, with the smallest of traders spending 53% of their volume on buying calls to open. That ranks as the 4th-most out of the 1,141 weeks since January 2000. It's even more extreme among large traders. 

Among all traders on all U.S. exchanges, net speculative volume is equal to the peak during the week ending February 12. There's no point showing the complete history as we did last week because extremes over the past year are so far beyond anything seen in the prior 20 years that it completely distorts a chart.

There's been a surge in speculative options activity

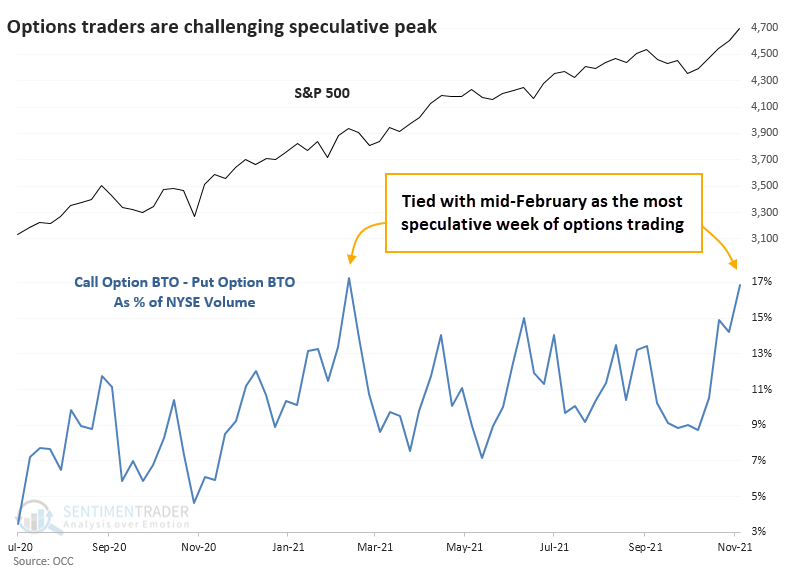
Implied volatility declined last week, so options prices were a little cheaper, but overall premiums spent on speculative trading remained near record highs.

The prior peaks didn't precede any significant damage in the S&P 500 - its price chart has been solidly up and to the right. But there were periods of several weeks following the other two speculative spikes where prices chopped around. And, it disguises some more notable weakness in other areas of the market.


What else we're looking at

  • What happened to sectors, S&P 500 stocks, and popular ETFs after the prior peak in speculative options activity
  • Stocks within the Consumer Discretionary sector have seen a notable thrust
  • What relative trends in overseas indexes are telling us
  • Following up on a successful bet on Russell 2000 options

Stat box

The most popular ETF in the world, SPY, has rallied for 8 consecutive days. This is only the 17th time it's done so since the fund's inception. All 17 signals preceded further gains over the next 150 trading days.

Etcetera

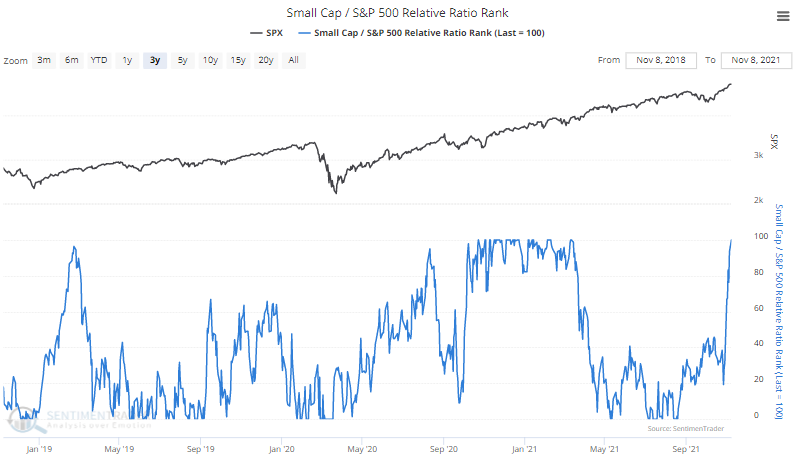
Small-cap cycle. Small-cap stocks have cycled from a period of underperformance to outperformance. Their Relative Ratio Rank is now 100%, typically a good sign for stocks in general as it shows risk-seeking behavior...until it doesn't.

Small cap relative ratio rank is 100%

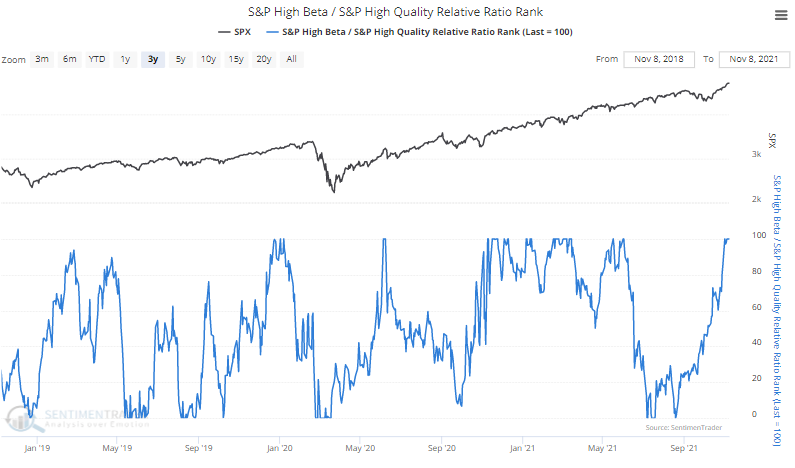
Party on, Wayne! High-beta stocks have been outperforming high-quality stocks. Their Relative Ratio Rank is also now at 100%, rebounding from 0% during September.

High beta stocks' relative ratio rank is 100%

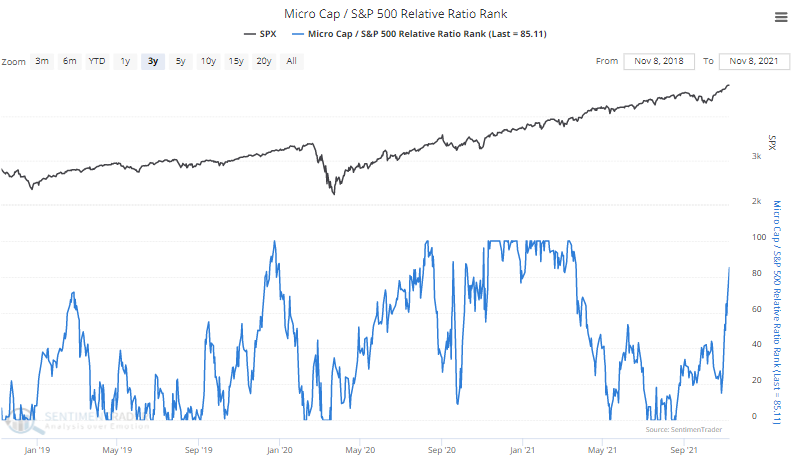
Party on, Garth! A rebound in Micro-Cap stocks is another sign of exuberant risk-seeking behavior. Their Relative Ratio Rank has jumped from 0% during the fall to over 80% now.

The relative ratio rank of micro cap stocks has soared

Indicators & Backtest Tools
IndicatorEdge
‍
BackTestEdge
‍
Other Tools
‍
DataEdge API
RESEARCH
reports
Research Solution
‍
Reports Library
‍
Strategies & Scanner
Trading Strategies
‍
Smart Stock Scanner
‍
FREE
RESOUrCES
Simple Backtest
Calculator
Simple Seasonality
Calculator
The Kelly Criterion
Calculator
Sentiment Geo Map
‍
Public Research Reports
‍
Free Webinar
COMPANY
‍
About
‍
Meet our Team
‍
In the News
‍
Testimonials
‍
Client Success Stories
Pricing
Bundle pricing
‍
Announcements
‍
FAQ
© 2024 Sundial Capital Research Inc. All rights reserved.
Setsail Marketing
TermsPrivacyAffiliate Program
Risk Disclosure: Futures and forex trading contains substantial risk and is not for every investor. An investor could potentially lose all or more than the initial investment. Risk capital is money that can be lost without jeopardizing ones’ financial security or life style. Only risk capital should be used for trading and only those with sufficient risk capital should consider trading. Past performance is not necessarily indicative of future results.

Hypothetical Performance Disclosure: Hypothetical performance results have many inherent limitations, some of which are described below. No representation is being made that any account will or is likely to achieve profits or losses similar to those shown; in fact, there are frequently sharp differences between hypothetical performance results and the actual results subsequently achieved by any particular trading program. One of the limitations of hypothetical performance results is that they are generally prepared with the benefit of hindsight. In addition, hypothetical trading does not involve financial risk, and no hypothetical trading record can completely account for the impact of financial risk of actual trading. for example, the ability to withstand losses or to adhere to a particular trading program in spite of trading losses are material points which can also adversely affect actual trading results. There are numerous other factors related to the markets in general or to the implementation of any specific trading program which cannot be fully accounted for in the preparation of hypothetical performance results and all which can adversely affect trading results.

Testimonial Disclosure: Testimonials appearing on this website may not be representative of other clients or customers and is not a guarantee of future performance or success.