
Option sentiment indicators suggesting a continuation rally

Key points
- For now, the S&P 500 Index remains in an uptrend above its 200-day moving average
- At the same time, several of option related indicators are flashing oversold signals
- From a weight of the evidence perspective, this has the earmarks of a buying opportunity
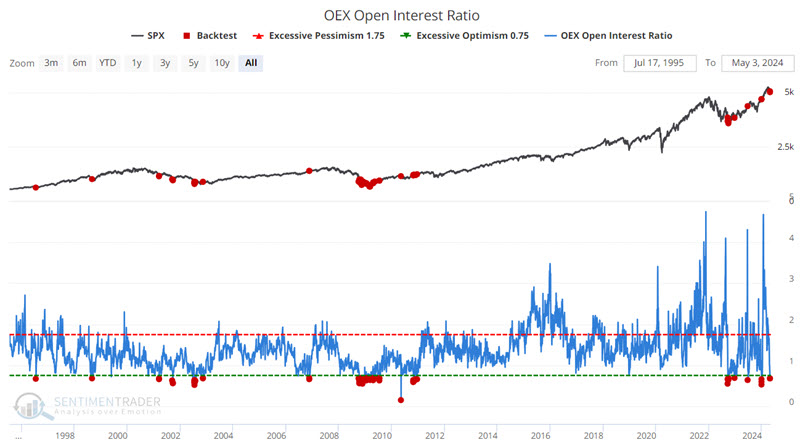
OEX Open Interest signals a sentiment extreme
OEX is shorthand for the S&P 100, an index of the 100 largest companies in the S&P 500. Open interest is defined as the total number of option contracts outstanding.
Open interest is increased by opening transactions and decreased by closing transactions. Someone buying a call to open (a bullish position) would increase open interest by one, and someone selling a call to open (a bearish position) would also increase open interest by one.
The open interest indicator takes the total put open interest and divides it by total call open interest - as more put contracts are opened (and/or call contracts closed), the indicator rises; as put contracts are closed (and/or call contracts opened), the indicator falls.
The OEX put/call open interest ratio should be considered non-contrarian. As put open interest rises in relation to call open interest, it suggests that OEX option traders - usually quite successful at identifying market turning points - are accumulating put positions. This is a bearish development. Conversely, if OEX traders are accumulating call positions, the put/call open interest ratio should fall, which is usually bullish.
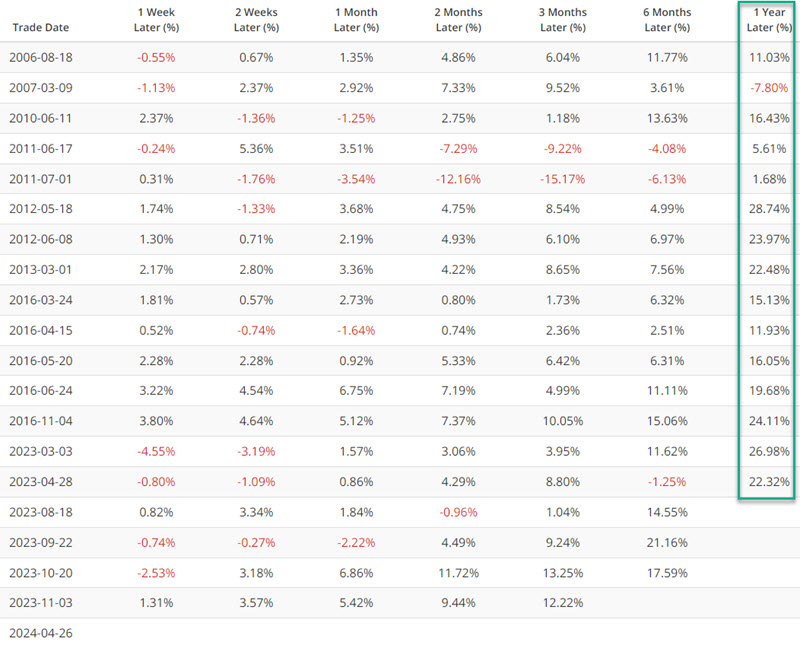
The chart below highlights all dates when the OEX Open Interest was below 0.70. The latest signal occurred on 2024-05-02.
The table below summarizes subsequent S&P 500 performance results.
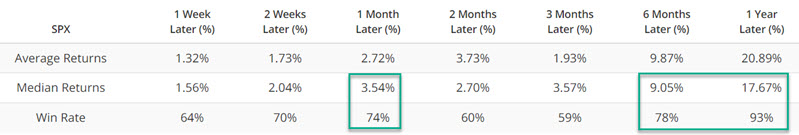
The signal should not be considered a standalone "buy" signal. It is best used as "weight of the evidence." The 1-month, 6-month, and 12-month Win Rates and Median Returns are well above average.
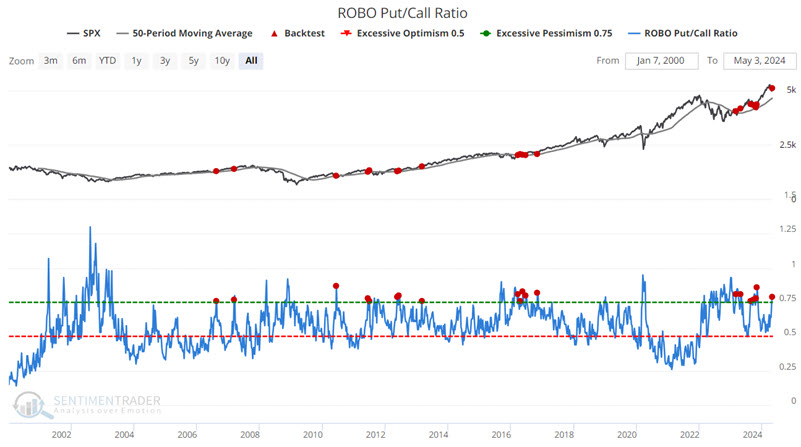
The ROBO Put/Call Ratio
ROBO is an acronym we coined for Retail-Only, Buy-to-Open.
This ratio focuses on small traders to better understand what they're trying to do. When looking at put/call information, it is helpful to see if the volume is going into opening or closing transactions, as this will tell us how aggressive the traders are in betting on a market move. Also, especially for very small traders, buying options to open is more telling than selling options to open.
A small trader buys a call option to open a position for one reason - they think the stock is going higher. They buy a put option to open because they believe the stock is going down. You may argue that they may be trying to hedge some underlying stock position, but it doesn't matter. If they think the stock is going up, they won't buy a put just for the thrill of it.
If we isolate the trades to those of 10 contracts or less and further restrict them to buys and opening transactions only, we can get an accurate picture of what retail traders (i.e., small brokerage firm customers) are doing.
This ratio only looks at buy-to-open transactions for trades under ten contracts. Therefore, it is an excellent read on the emotions of the smallest traders and should be interpreted in a contrary manner.
When the ROBO put/call ratio is high, small traders are buying many puts in relation to calls, which suggests that they believe their stocks will decline. This is bullish for the market once it reaches an extreme. On the other hand, when these traders are so confident of their stocks rising that the ROBO ratio drops to a low level, we need to be aware that sentiment is becoming too frothy, and a market decline may soon be at hand.
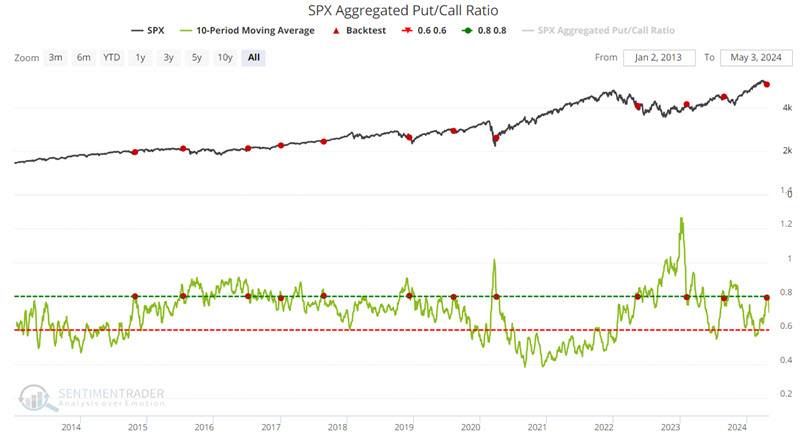
The chart below highlights those dates when the ROBO Put/Call Ratio crossed above 0.75 while the S&P 500 was above its 50-day moving average. The latest signal occurred on 2024-04-26.
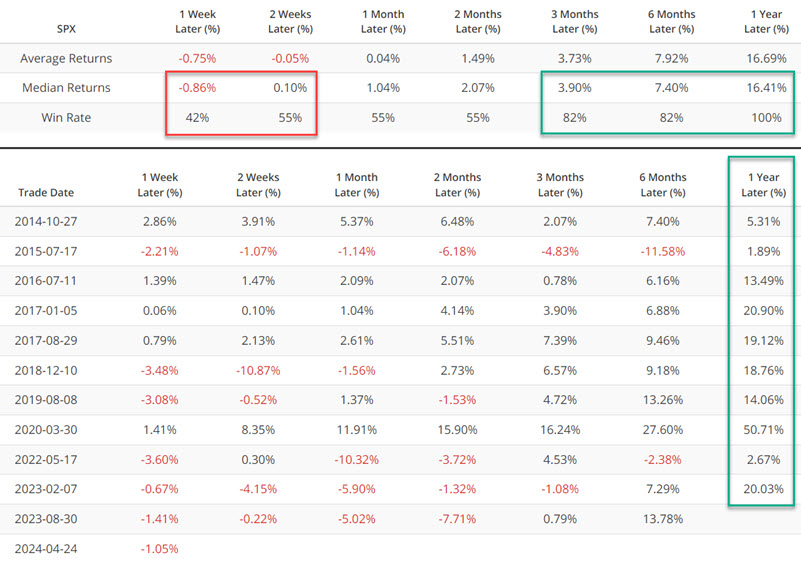
The table below summarizes S&P 500 performance results.
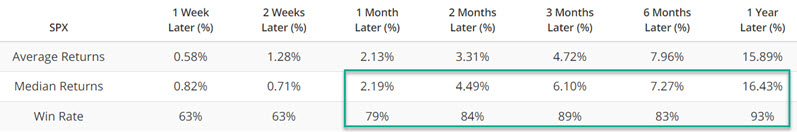
The table below displays signal-by-signal results.
The high Win Rates for one-month to twelve-month periods suggest that this signal generally highlights buying opportunities within the context of an ongoing bull market.
The SPX Aggregated Put/Call Ratio reverses
This indicator consists of the aggregated option data for constituent stocks of the S&P 500 Index. Typically, this data is most important when it reaches an extreme. However, extreme readings often occur while a significant decline is in progress. Using these extreme readings as a standalone buy signal can result in a trader buying into the teeth of a vicious decline. While this can occasionally be an extremely profitable exercise, it can also lead to quick, significant interim losses and a great deal of psychological stress. So, let's consider an alternative approach.
For this test, the chart below highlights those dates when the 10-day average for our SPX Aggregated Put/Call Ratio crossed below 0.8 for the first time in six months. In other words, we look for an extreme reading (a 10-day average above 0.8) and then a reversal from that extreme (hopefully, after the decline that caused the spike in options, trader fear has abated). We only take one signal within a six-month period.
The table below summarizes SPX performance and displays signal-by-signal results. The most recent signal occurred on 2024-04-24. Overall, the first two months after a signal have been something of a coin flip. However, Win Rates for three to twelve months have been well above average.
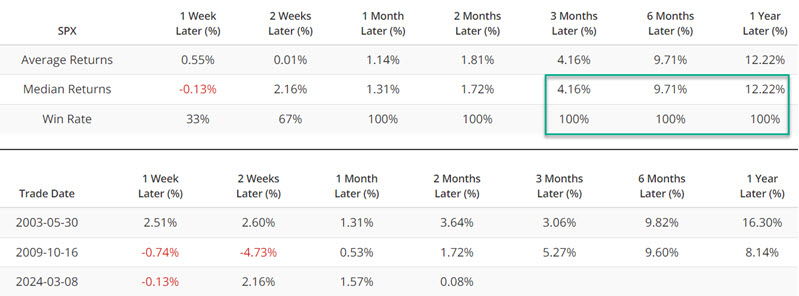
The Put/Call Premium also crosses a significant level
This is the ratio of total put premiums paid each week relative to total call premiums, so it directly reflects how much options traders are paying for one relative to the other. That makes it an effective measure of real money, real-time, and leveraged sentiment. When it rises to an extreme, it is a highly reliable gauge of option-trader panic.
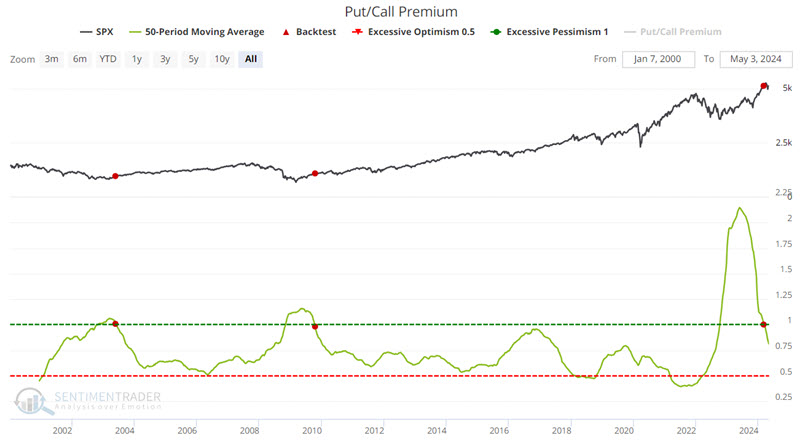
In this case, we will use it like the SPX Aggregated Put/Call Ratio and wait for a reversal from an extreme - and for the indicator value to cross back below a significant level. The chart below highlights those rare occasions when the 50-day average of the Put/Call Premium crossed below 1.00. As you can see, the sample size is minuscule, so we would normally not point to this one alone. However, it does seem worth mentioning here in the context of the other indicators highlighted above.
What the research tells us…
The recent signals highlighted above do not guarantee a resumption of a broader stock market advance soon - or at all, for that matter. However, when considered together, there is a clear pattern in place. The broader market is still in a price uptrend (i.e., above its longer-term moving average), and option sentiment indicators have now flashed bullish signals. From a weight of the evidence approach, this is a textbook scenario of a standard market pullback (and ultimately a buying opportunity - although timing an exact bottom is essentially impossible). That said, how quickly things might actually turn around (if at all) and how far a rebound might run is never guaranteed.