
NYSE 52-Week High-Low Ratio Risk-Off Model

In my note on Tuesday, I reviewed the S&P 500 New Low Spike Model and discussed the importance of monitoring the new lows list when the broad market is advancing. I also shared why I prefer S&P 500 and NYSE exchange lows versus other indexes and exchanges. In my note today, I plan to review an additional risk warning model component that utilizes NYSE 52-week highs and lows to identify risk-off periods.
Components
1.) Number of NYSE 52-Week Highs
2.) Number of NYSE 52-Week Lows
NYSE 52-Week High Low Ratio Risk-Off Model
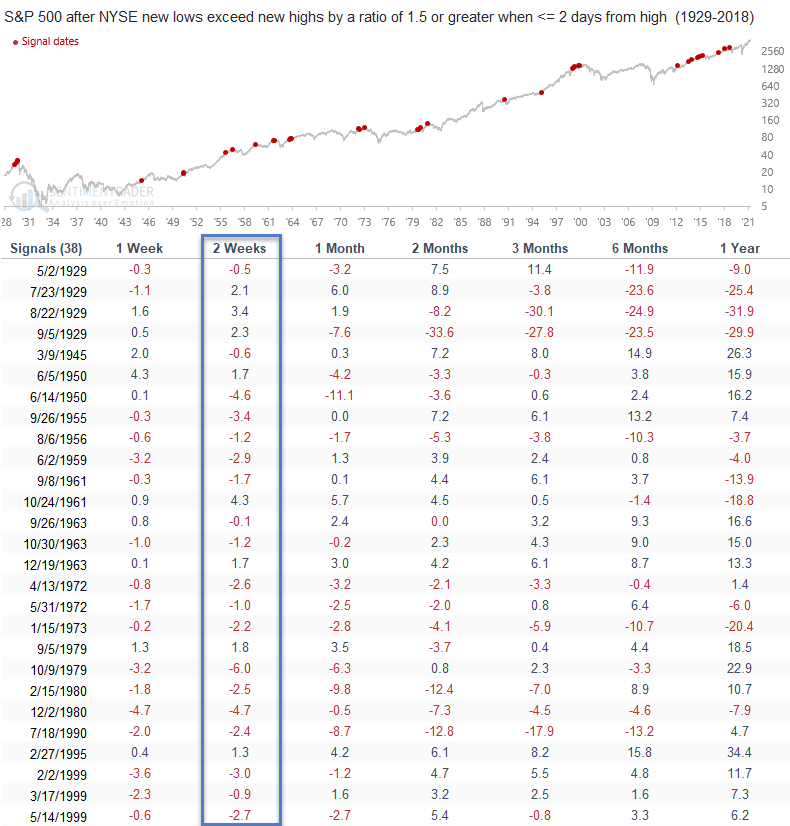
The NYSE 52-week high low ratio model seeks to identify instances in history when new lows exceed new highs by a ratio of 1.5 or greater when the S&P 500 index is trading within two days of a 252-day high. The model will issue an alert based upon the following conditions.
Signal Criteria
Condition1 = NYSE new lows/new highs ratio >= 1.5.
Condition2 = S&P 500 Index <= 2 days from a 252-day high.
Condition3 = NYSE new lows/new highs ratio cross above 1.0. i.e., the reset screens out duplicate signals.
Edit: the original note said 1.0% in condition 3. That was a typo. The ratio should cross back above 1.0.
If Condition 1-3, signal risk-off.
Let's take a look at some charts and the historical signal performance.
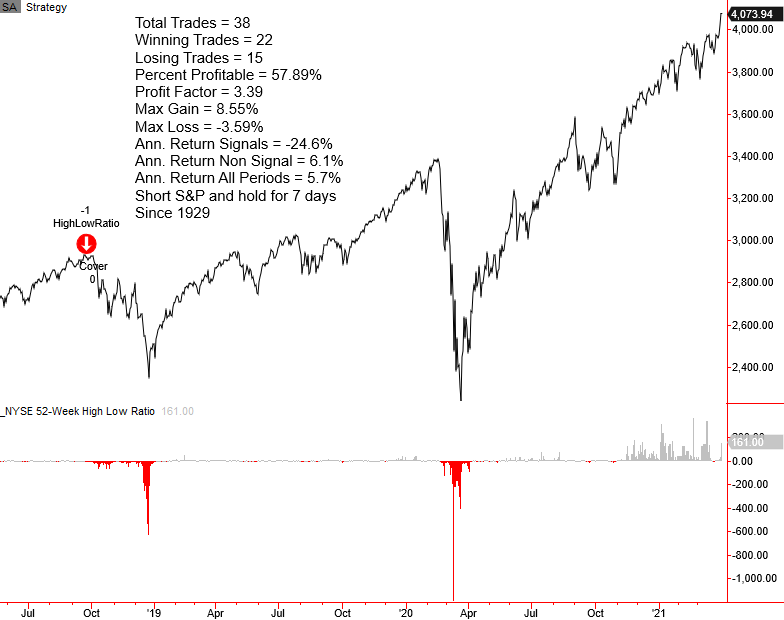
Current Day Chart
Please note, I calculate performance statistics in the chart as a short signal, whereas annualized returns result from buying the S&P 500.
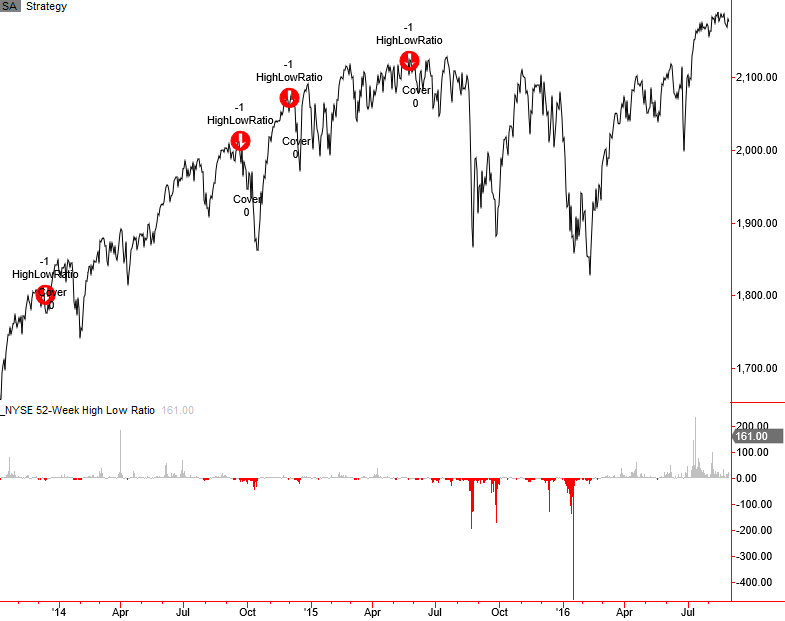
2015-16 Oil/Commodity Bear
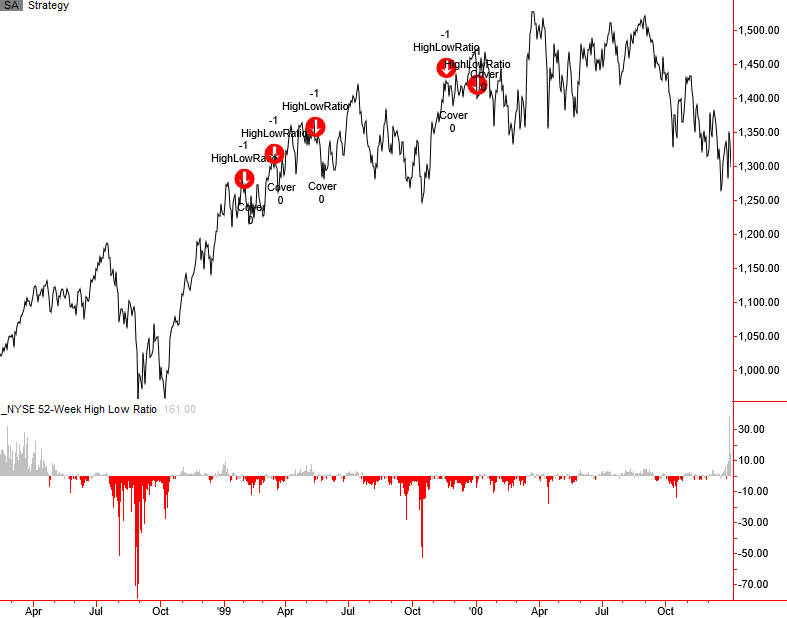
2000 Internet Bubble
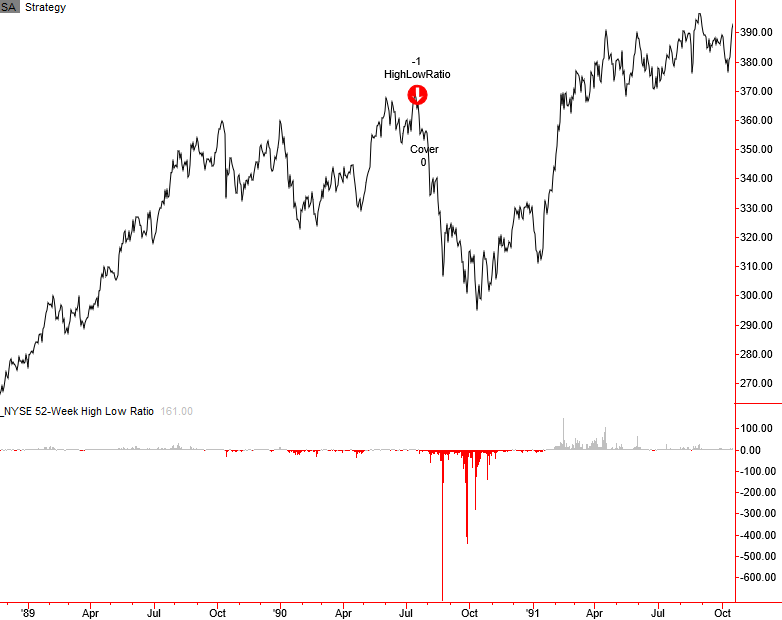
1990 Savings & Loan/Iraq Oil Spike
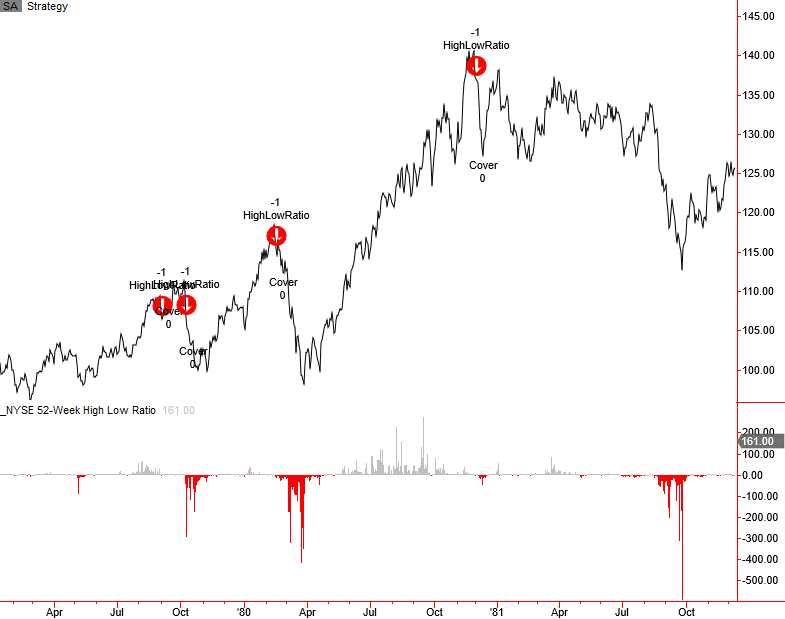
1980 Energy/Commodity Bubble
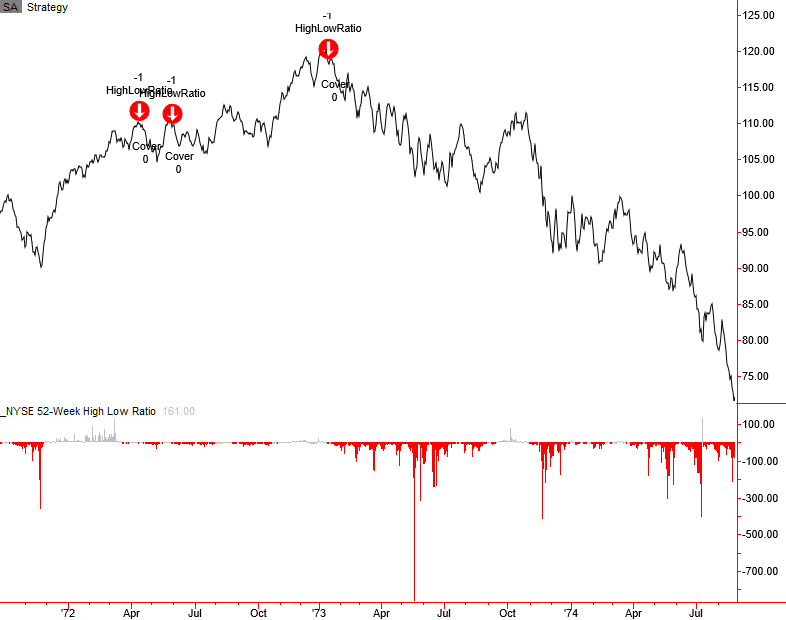
1973-74 Bretton Woods/Nixon Shock/Oil Crisis
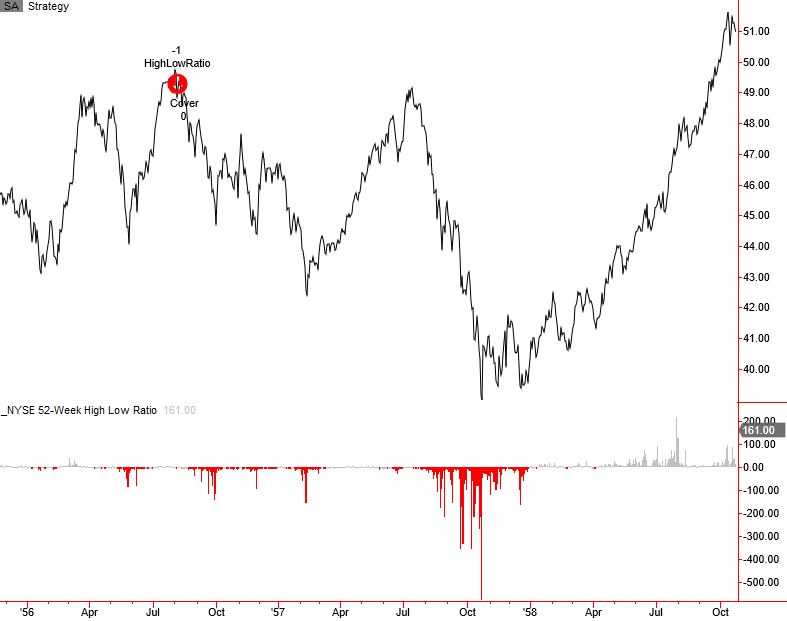
1957-58 Bear Market
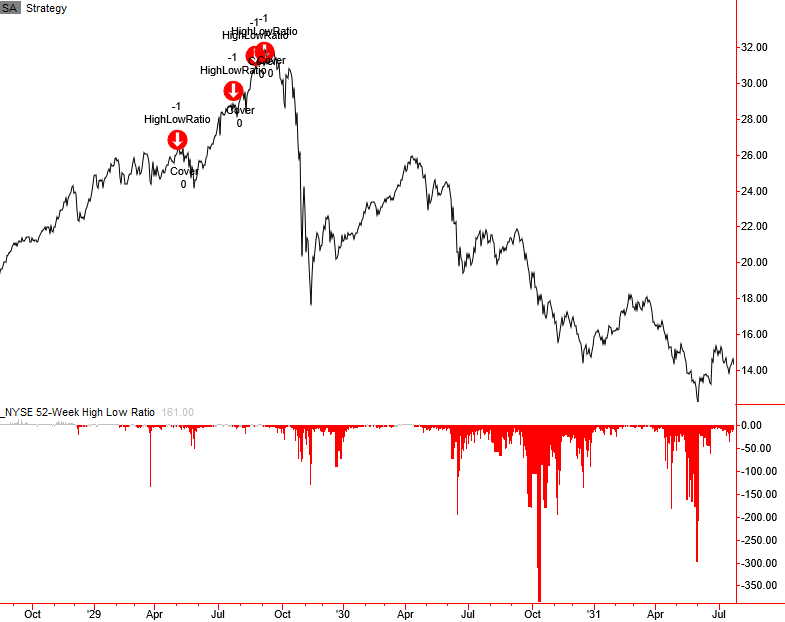
1929-32 Bear Market
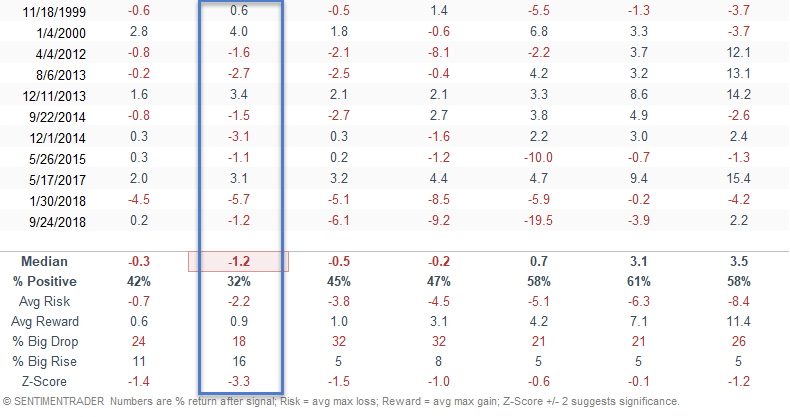
Signal Performance
As one can see, performance is weak across all timeframes with a notable z-score in the 2-week timeframe.
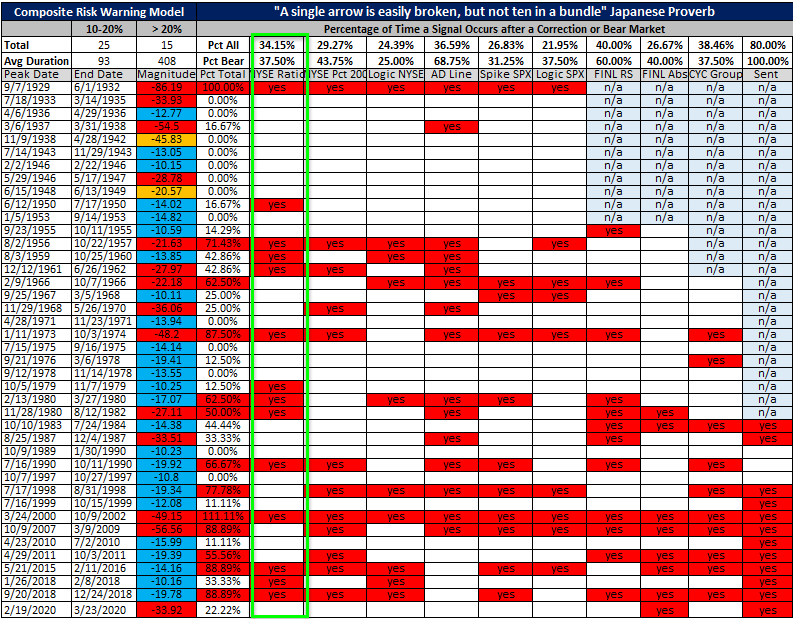
Historical TCTM Risk Warning Model Table
Conclusion: While the ratio of new lows to new highs recently exceeded the threshold level in late March due to a downdraft in speculative stocks, the model did not trigger as the two-day from the high condition was not valid.