Data &
Technology
Research
Reports
Report Solutions
Reports Library
Actionable
Strategies
Free
Resources
Simple Backtest Calculator
Simple Seasonality Calculator
The Kelly Criterion Calculator
Sentiment Geo Map
Public Research Reports
Free Webinar
Pricing
Company
About
Meet Our Team
In the News
Testimonials
Client Success Stories
Contact
Log inLoginSign up
< BACK TO ALL REPORTS

No need to hedge when stocks only go up

Jason Goepfert
2020-12-22
As stocks continue to power higher, hedging activity has dropped off and is now among the lowest it's been in 20 years.

In recent weeks, we've had occasion to yet again focus on the behavior of options traders. Depending on the metric, we're currently seeing a record or near-record level of speculation, with very little hedging.

Nothing much has changed. Among all strategies and all traders, the focus on strategies that only pay out if stocks rise continues to hover near record highs, with our Option Speculation Index showing that bullish volume is significantly higher than bearish volume. 

Adding to the concern is that hedging activity, in the options market or elsewhere, has become scarce. The Equity Hedging Index (EHI) is now in the lowest 6% of all readings since 1986.

The EHI looks at the most common ways an investor would hedge their portfolio. The more each indicator shows hedging activity, the higher the Equity Hedging Index will be; the lower the EHI, the less hedging is happening.

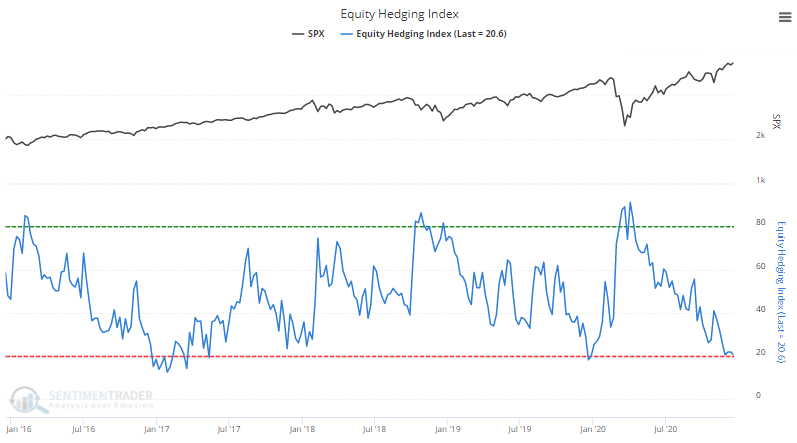
Since 1986, when the EHI is below 21, the S&P 500's annualized return has been -2.4% versus +49.8% when the EHI is above 85, suggesting a higher probability of lower returns now given the current reading of the indicator.


What else is happening

These are topics we explored in our most recent research. For immediate access with no obligation, sign up for a 30-day free trial now.

  • A more in-depth look at last weeks' options trading relative to the past 20 years
  • Two other option indicators suggest that institutional investors are, however, establishing some hedges
  • What happens when those 2 metrics have been high for weeks on end

Stat Box

Some wild trading on Monday led to the VIX "fear gauge" spiking more than 40% intraday and then dropping more than 20% into the close. In the past 30 years, it has engineered such severe whiplash only 4 other times, all of which ended up leading to an even lower VIX in the weeks ahead.

Sentiment from other perspectives

We don't necessarily agree with everything posted here - some of our work might directly contradict it - but it's often worth knowing what others are watching.

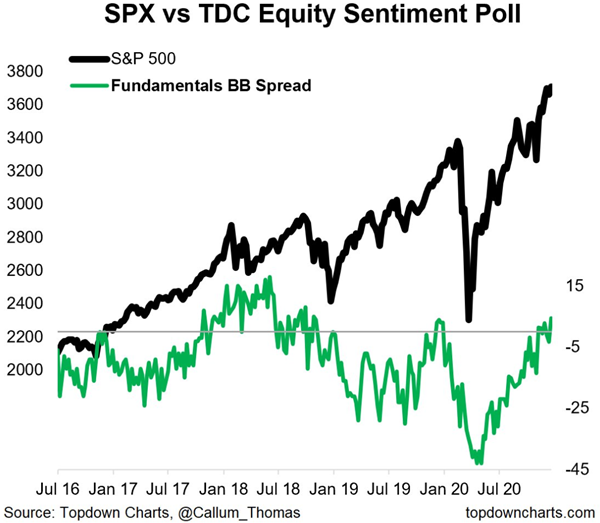
1. As stocks have risen, investors have become even more optimistic on its fundamental underpinnings. That's the nature of sentiment - the crowd reacts to momentum more than economics, and will pay increasing prices for something simply because it's going up. [Topdown Charts]

investor fundamental sentiment

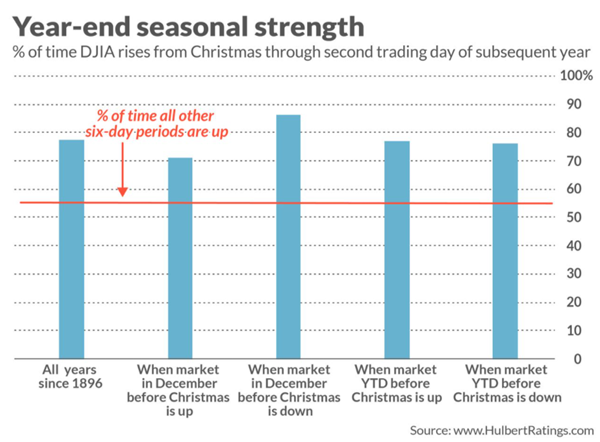
2. They may say they're betting on improving fundamentals to sound smart, but really they're betting that good tidings will persist even after Santa leaves town. Stocks have a better-than-random chance of rising into the New Year. [MarketWatch]

santa rally seasonality

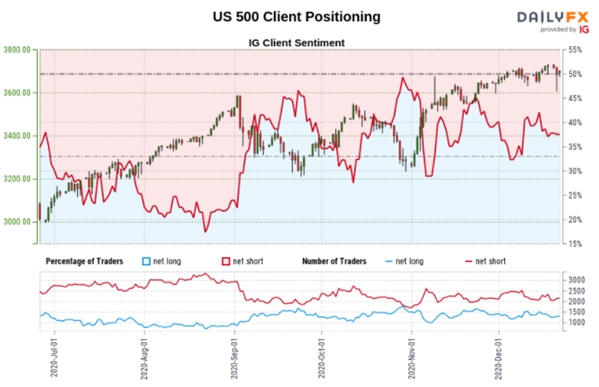
3. Futures traders (at one brokerage, anyway) aren't really buying into this idea. They're less than 40% net long, on the lower end of their range for the past few months. [DailyFX]

s&p sentiment forex traders net long net short

DATA &
TECHnologies
IndicatorEdge
‍
BackTestEdge
‍
Other Tools
‍
DataEdge API
RESEARCH
reports
Research Solution
‍
Reports Library
‍
actionable
Strategies
Trading Strategies
‍
Smart Stock Scanner
‍
FREE
RESOUrCES
Simple Backtest
Calculator
Simple Seasonality
Calculator
The Kelly Criterion
Calculator
Sentiment Geo Map
‍
Public Research Reports
‍
Free Webinar
COMPANY
‍
About
‍
Meet our Team
‍
In the News
‍
Testimonials
‍
Client Success Stories
Pricing
Bundle pricing
‍
Announcements
‍
FAQ
© 2024 Sundial Capital Research Inc. All rights reserved.
Setsail Marketing
TermsPrivacyAffiliate Program
Risk Disclosure: Futures and forex trading contains substantial risk and is not for every investor. An investor could potentially lose all or more than the initial investment. Risk capital is money that can be lost without jeopardizing ones’ financial security or life style. Only risk capital should be used for trading and only those with sufficient risk capital should consider trading. Past performance is not necessarily indicative of future results.

Hypothetical Performance Disclosure: Hypothetical performance results have many inherent limitations, some of which are described below. No representation is being made that any account will or is likely to achieve profits or losses similar to those shown; in fact, there are frequently sharp differences between hypothetical performance results and the actual results subsequently achieved by any particular trading program. One of the limitations of hypothetical performance results is that they are generally prepared with the benefit of hindsight. In addition, hypothetical trading does not involve financial risk, and no hypothetical trading record can completely account for the impact of financial risk of actual trading. for example, the ability to withstand losses or to adhere to a particular trading program in spite of trading losses are material points which can also adversely affect actual trading results. There are numerous other factors related to the markets in general or to the implementation of any specific trading program which cannot be fully accounted for in the preparation of hypothetical performance results and all which can adversely affect trading results.

Testimonial Disclosure: Testimonials appearing on this website may not be representative of other clients or customers and is not a guarantee of future performance or success.