Indicators &
Backtest Tools
Research
Reports
Report Solutions
Reports Library
Strategies
& Scanner
Free
Resources
Simple Backtest Calculator
Simple Seasonality Calculator
The Kelly Criterion Calculator
Sentiment Geo Map
Public Research Reports
Free Webinar
Pricing
Company
About
Meet Our Team
In the News
Testimonials
Client Success Stories
Contact
Log inLoginSign up
< BACK TO ALL REPORTS

Nasdaq stocks have never acted like this

Jason Goepfert
2022-01-07
Nealy 40% of Nasdaq stocks are down 50% from their highs, even as the Composite is only down 6%. There has been a breadth thrust in S&P 500 stocks.

An unprecedented number of Nasdaq stocks have been cut in half

Valuations are at historical highs, companies are raising billions based on fairy dust, and the Fed is signaling a tightening cycle. All of these are scaring investors that we're on the cusp of a repeat of 1999-2000.

There are certainly some valid comparisons to that period. And there are some compelling counter-arguments as well. Whatever the fundamental and macro considerations, there is no doubt that investors have been selling first and trying to figure out the rest later.

Since the speculative mania in January/February 2021, many of the riskiest stocks have tumbled. It just so happens many of those stocks trade on the Nasdaq exchange.

After Wednesday's post-FOMC selloff, more than 38% of stocks trading on the Nasdaq are now down 50% from their 52-week highs. Only 13% of days since 1999 have seen more stocks cut in half.

Nearly 40% of Nasdaq stocks are down 50%

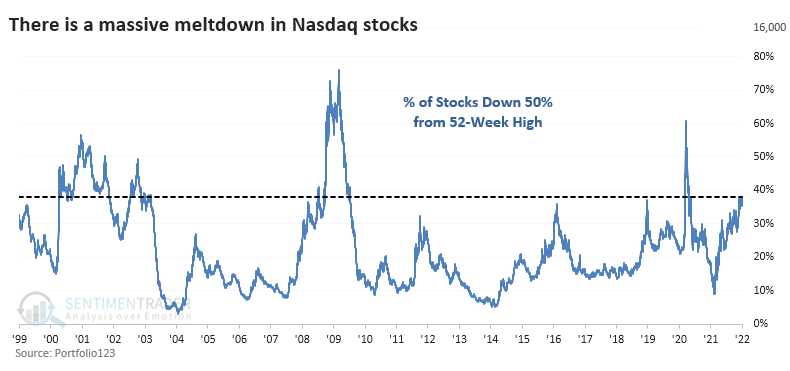
At no other point since at least 1999 have so many stocks been cut in half while the Nasdaq Composite index was so close to its peak. When at least 35% of stocks are down by half, the Composite has been down by an average of 47% (!) from its 3-year high.

Bulls will suggest that most of the damage has been done, and the indexes should be able to soar from here. Bears will say this is just like the internet bubble, and the index is about to "catch down" to the average stock.

To get a sense of who may most likely be correct, we took a look at similar behavior over the past 23 years.

Stat box

BTFD? Traders have plowed an average of $300 million per day over the past 3 days into the SMH Semiconductor fund. That's the largest 3-day average in the fund's history.


An impressive 10-day run

Dean noted that a new signal from a voting member in the composite thrust model registered an alert on Tuesday.

The breadth thrust system identifies when the 10-day sum of S&P 500 advancing issues exceeds the 10-day sum of S&P 500 declining issues by a ratio of 2.02 to 1. I use a reset condition to screen out repeats, which requires the ratio to fall below 0.8 before a new signal can trigger again.

S&P 500 advance decline breadth thrust

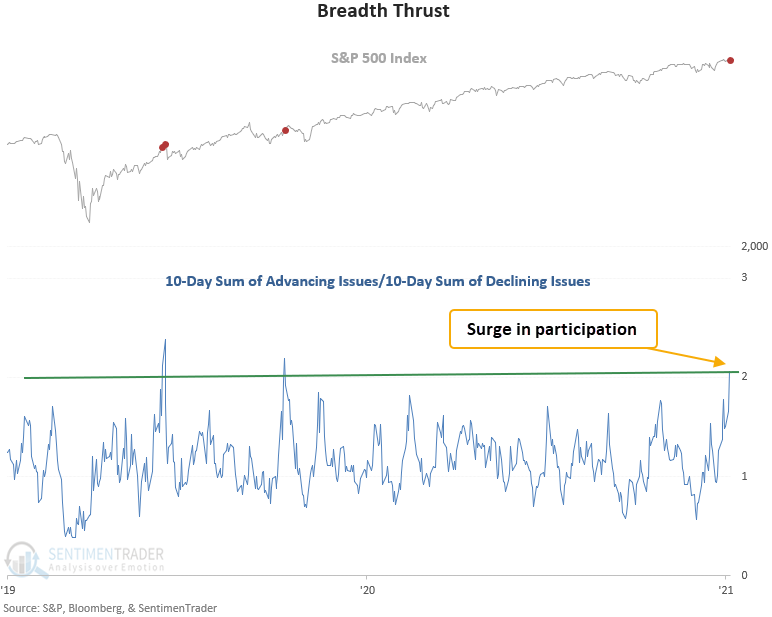
This signal has triggered 56 other times over the past 90 years. After the others, future returns, win rates, and risk/reward profiles were solid across all time frames. Since 1942, the win rate in the 12-month time frame has been excellent, with 44 out of 48 winners. 

Indicators & Backtest Tools
IndicatorEdge
‍
BackTestEdge
‍
Other Tools
‍
DataEdge API
RESEARCH
reports
Research Solution
‍
Reports Library
‍
Strategies & Scanner
Trading Strategies
‍
Smart Stock Scanner
‍
FREE
RESOUrCES
Simple Backtest
Calculator
Simple Seasonality
Calculator
The Kelly Criterion
Calculator
Sentiment Geo Map
‍
Public Research Reports
‍
Free Webinar
COMPANY
‍
About
‍
Meet our Team
‍
In the News
‍
Testimonials
‍
Client Success Stories
Pricing
Bundle pricing
‍
Announcements
‍
FAQ
© 2024 Sundial Capital Research Inc. All rights reserved.
Setsail Marketing
TermsPrivacyAffiliate Program
Risk Disclosure: Futures and forex trading contains substantial risk and is not for every investor. An investor could potentially lose all or more than the initial investment. Risk capital is money that can be lost without jeopardizing ones’ financial security or life style. Only risk capital should be used for trading and only those with sufficient risk capital should consider trading. Past performance is not necessarily indicative of future results.

Hypothetical Performance Disclosure: Hypothetical performance results have many inherent limitations, some of which are described below. No representation is being made that any account will or is likely to achieve profits or losses similar to those shown; in fact, there are frequently sharp differences between hypothetical performance results and the actual results subsequently achieved by any particular trading program. One of the limitations of hypothetical performance results is that they are generally prepared with the benefit of hindsight. In addition, hypothetical trading does not involve financial risk, and no hypothetical trading record can completely account for the impact of financial risk of actual trading. for example, the ability to withstand losses or to adhere to a particular trading program in spite of trading losses are material points which can also adversely affect actual trading results. There are numerous other factors related to the markets in general or to the implementation of any specific trading program which cannot be fully accounted for in the preparation of hypothetical performance results and all which can adversely affect trading results.

Testimonial Disclosure: Testimonials appearing on this website may not be representative of other clients or customers and is not a guarantee of future performance or success.