Data &
Technology
Research
Reports
Report Solutions
Reports Library
Actionable
Strategies
Free
Resources
Simple Backtest Calculator
Simple Seasonality Calculator
The Kelly Criterion Calculator
Sentiment Geo Map
Public Research Reports
Free Webinar
Pricing
Company
About
Meet Our Team
In the News
Testimonials
Client Success Stories
Contact
Log inLoginSign up
< BACK TO ALL REPORTS

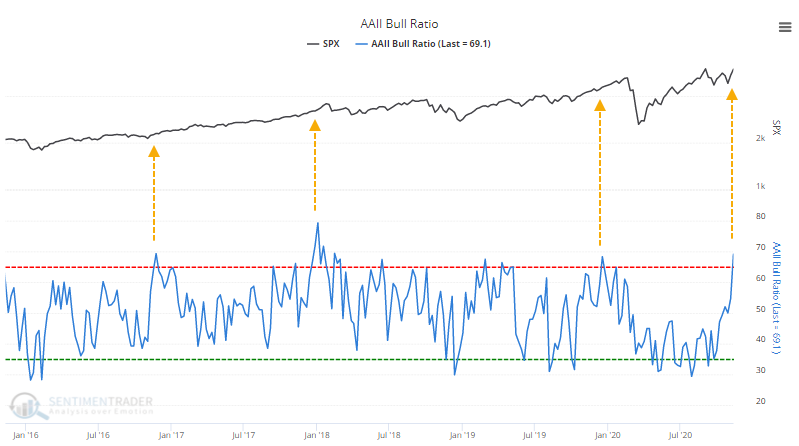
Mom and pop finally turn optimistic

Jason Goepfert
2020-11-12
The latest AAII survey shows a nearly 70% ratio of bulls to bears, the highest in years. When optimism turns high after a protracted period of pessimism, it has led to above-average returns, especially over the past decade.

We might as well get this out of the way. Bullishness in a weekly survey of individual investors has spiked to the highest level in years, and that's causing concern that optimism is out of control.

The percentage of bulls in the American Association of Individual Investors (AAII) survey rose to 55.8% while bears dropped to 24.9%, pushing the Bull Ratio, a more accurate measure of optimism, above 69%. The last 2 times it got this high, stocks ended up running into trouble eventually.

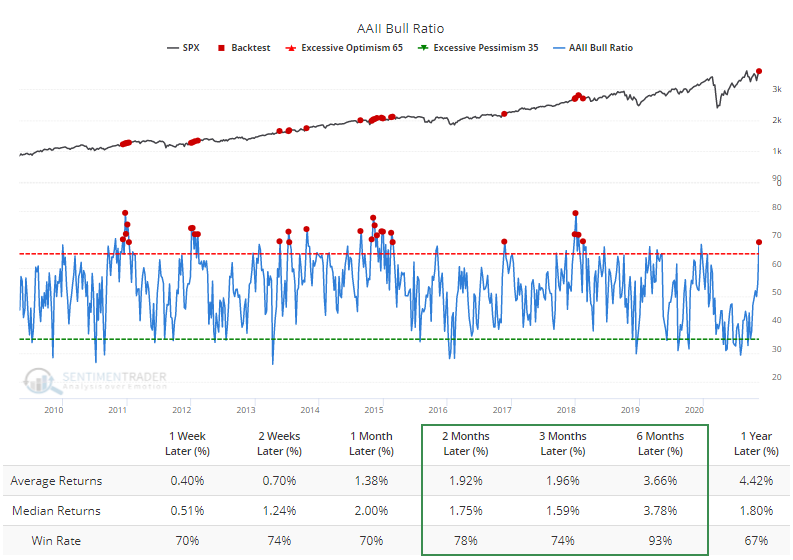
If we take about 15 seconds of our time to see what this has objectively meant in the past, then the Backtest Engine shows that over the past decade, a reading this high led to above-average returns for the S&P 500 in the months ahead. Over the next 26 weeks, the S&P 500 showed a positive return after 25 out of 27 signals.

Context is important, and so let's look at those times when the survey showed more than 2 bulls out of every 3 investors for the 1st time in more than 9 months.

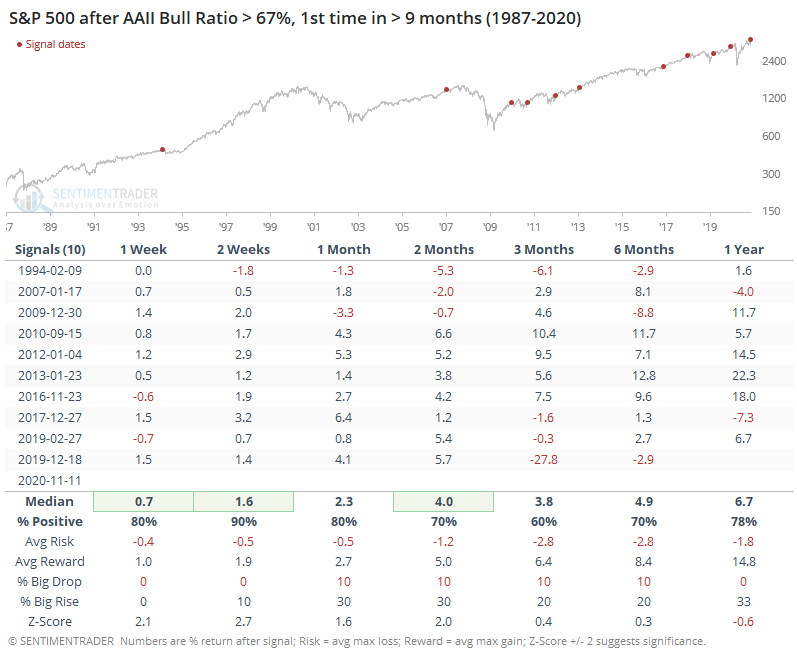
Again, not much to suggest a major worry here, though the last signal clearly resulted in some heartburn after an initial large rally through the beginning of this year.

The results are skewed by a large number of occurrences in the past decade, which was dominated by a momentum-driven bull market. If we relax the parameters, then we can get more samples from earlier time periods.

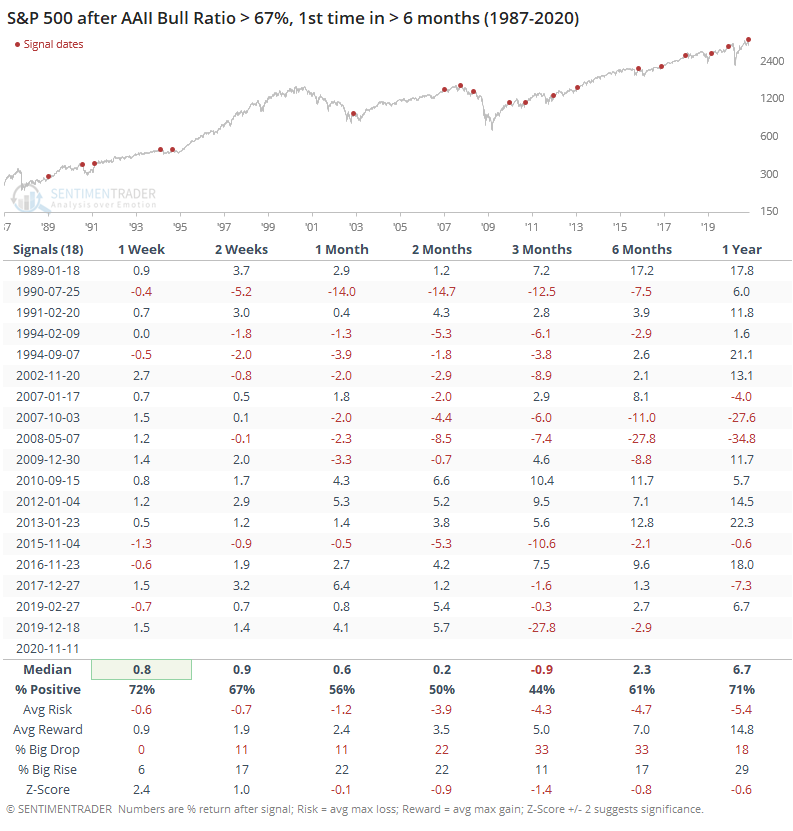
Here, results weren't so pristine. Prior to the last decade, the S&P most often showed a loss over the next 1-3 months, so that's a bit of a concern.

Another way to see the current extreme is the rate of change. The Bull Ratio has increased by more than 35% over the past 10 weeks, one of the largest changes going back to 1987.

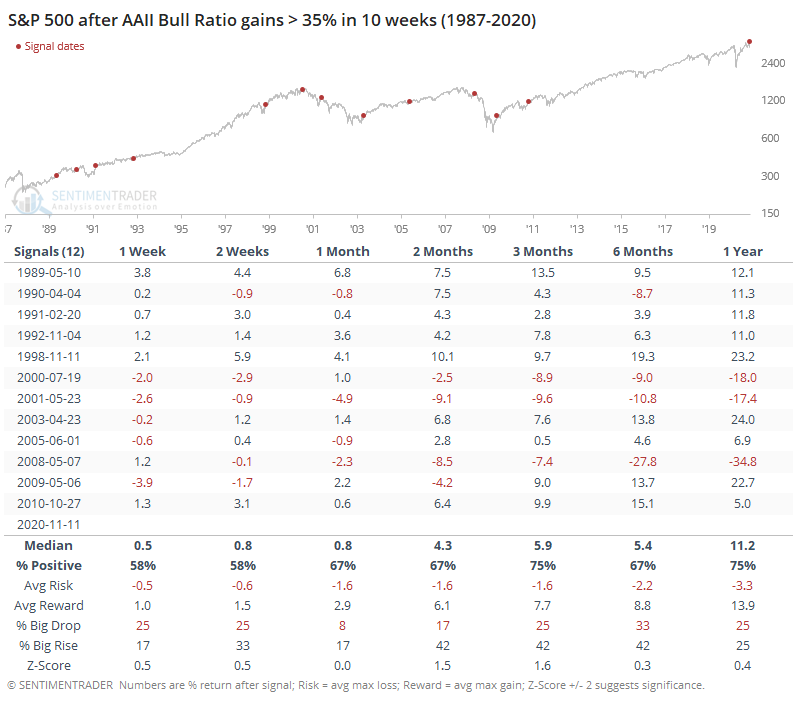
This, too, wasn't a consistent sell signal. While 3 of them led to very large losses over the next 6-12 months, those were the clear exceptions, with an overall risk/reward ratio that was heavily skewed to the upside.

The rapid rise in optimism in this survey, which is now to a high level, should not be a major worry. Some large declines began weeks after behavior like this, but those were the exceptions. Historically, these kinds of readings have led to above-average returns, and consistently higher prices. The biggest concern is that prior to the last decade or so, the next 1-3 months showed mostly moderate losses.

Sorry, you don't have access to this report

Upgrade your subscription plan to get access
Go to Dasboard
DATA &
TECHnologies
IndicatorEdge
‍
BackTestEdge
‍
Other Tools
‍
DataEdge API
RESEARCH
reports
Research Solution
‍
Reports Library
‍
actionable
Strategies
Trading Strategies
‍
Smart Stock Scanner
‍
FREE
RESOUrCES
Simple Backtest
Calculator
Simple Seasonality
Calculator
The Kelly Criterion
Calculator
Sentiment Geo Map
‍
Public Research Reports
‍
Free Webinar
COMPANY
‍
About
‍
Meet our Team
‍
In the News
‍
Testimonials
‍
Client Success Stories
Pricing
Bundle pricing
‍
Announcements
‍
FAQ
© 2024 Sundial Capital Research Inc. All rights reserved.
Setsail Marketing
TermsPrivacyAffiliate Program
Risk Disclosure: Futures and forex trading contains substantial risk and is not for every investor. An investor could potentially lose all or more than the initial investment. Risk capital is money that can be lost without jeopardizing ones’ financial security or life style. Only risk capital should be used for trading and only those with sufficient risk capital should consider trading. Past performance is not necessarily indicative of future results.

Hypothetical Performance Disclosure: Hypothetical performance results have many inherent limitations, some of which are described below. No representation is being made that any account will or is likely to achieve profits or losses similar to those shown; in fact, there are frequently sharp differences between hypothetical performance results and the actual results subsequently achieved by any particular trading program. One of the limitations of hypothetical performance results is that they are generally prepared with the benefit of hindsight. In addition, hypothetical trading does not involve financial risk, and no hypothetical trading record can completely account for the impact of financial risk of actual trading. for example, the ability to withstand losses or to adhere to a particular trading program in spite of trading losses are material points which can also adversely affect actual trading results. There are numerous other factors related to the markets in general or to the implementation of any specific trading program which cannot be fully accounted for in the preparation of hypothetical performance results and all which can adversely affect trading results.

Testimonial Disclosure: Testimonials appearing on this website may not be representative of other clients or customers and is not a guarantee of future performance or success.