Data &
Technology
Research
Reports
Report Solutions
Reports Library
Actionable
Strategies
Free
Resources
Simple Backtest Calculator
Simple Seasonality Calculator
The Kelly Criterion Calculator
Sentiment Geo Map
Public Research Reports
Free Webinar
Pricing
Company
About
Meet Our Team
In the News
Testimonials
Client Success Stories
Contact
Log inLoginSign up
< BACK TO ALL REPORTS

Manufacturing Soars - Another Lesson in The Stock Market as a Discounting Mechanism

Jay Kaeppel
2021-04-06
We are conditioned to cheer good economic news and to rue bad economic news. When it comes to investing in stocks this little bit of human nature can be counterproductive. The ISM Purchasing Managers Index (PMI) provides a classic case in point.

Many cheered the high 64.7% reading for the ISM Purchasing Managers Index (PMI) released at the end of March. And why not? Everybody loves a booming economy. Plenty of opportunities to make money via work and/or the financial markets. But people often seem to forget that the stock market is a discounting mechanism and that the stock market often looks the worst - and presents the best buying opportunities - when the economy looks terrible.

Take the PMI for example. Human nature tells us that we should be happiest when this index is at a high level - thereby indicating that manufacturing and by extension, the economy is strong. One might intuitively assume that this is when the stock market performs the best. And one would be wrong. Very wrong as it turns out. 

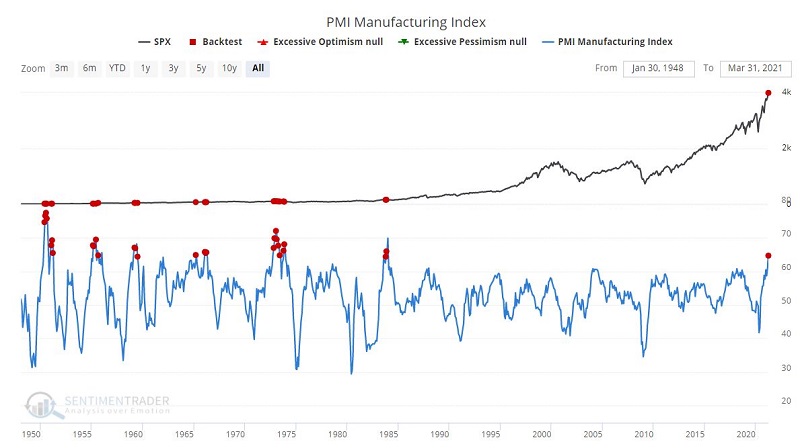
The chart below highlights those rare instances when the PMI fell to 40 or below. Note that this is a very rare occurrence.

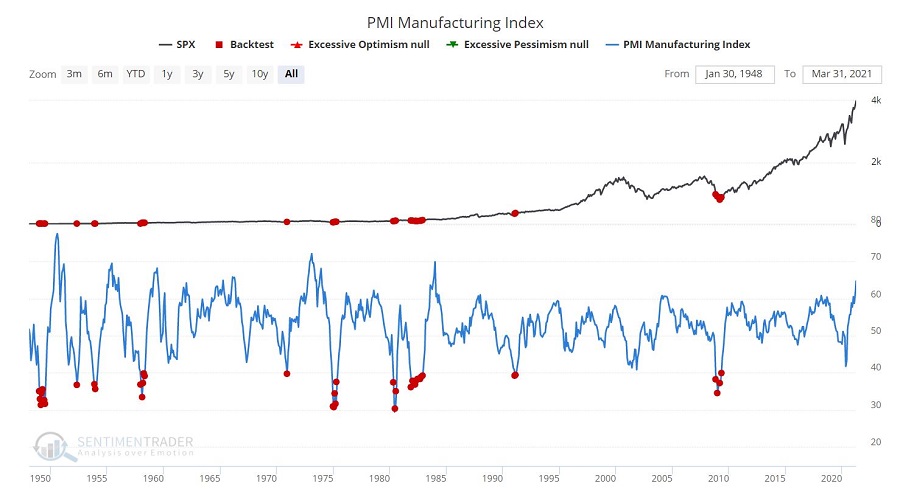
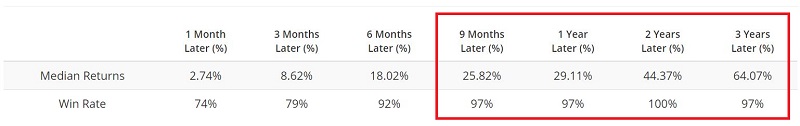
The table below displays the typical performance of the S&P 500 Index following PMI reads below 40.  Note that a median 1-year return of +29.11% is about as good as it gets for a stock market indicator.

If we look only at those instances where "PMI below 40" signals are at least 12 months apart, we get the results shown below.

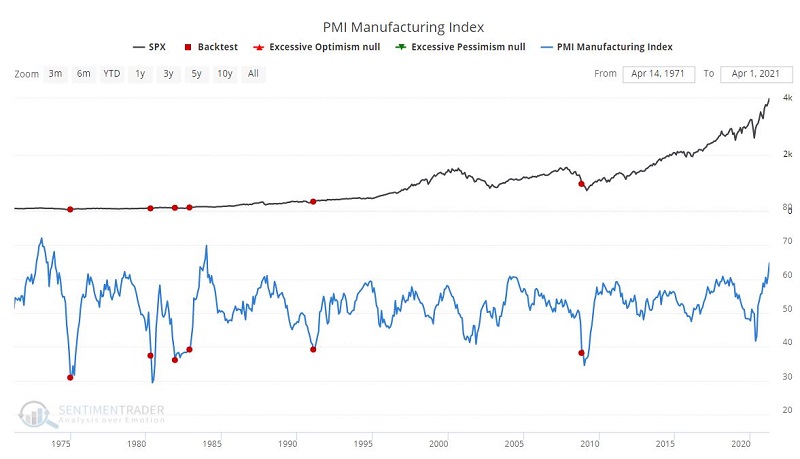
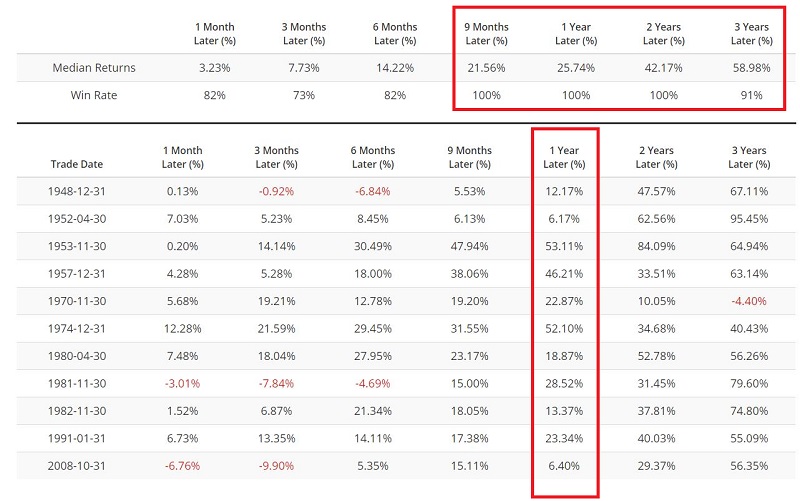
Note the consistent and large returns 9 months to 3 years after such signals. What this tells us is that when the PMI reaches a very low level it is a signal that the economy is reaching a bottom and that the stock market will soon begin to discount the impending upward reversal in the economy.

If we relax the parameters just a little bit from 40 to 42, we also pick up signals in mid and late 2001 as well as April of 2020.

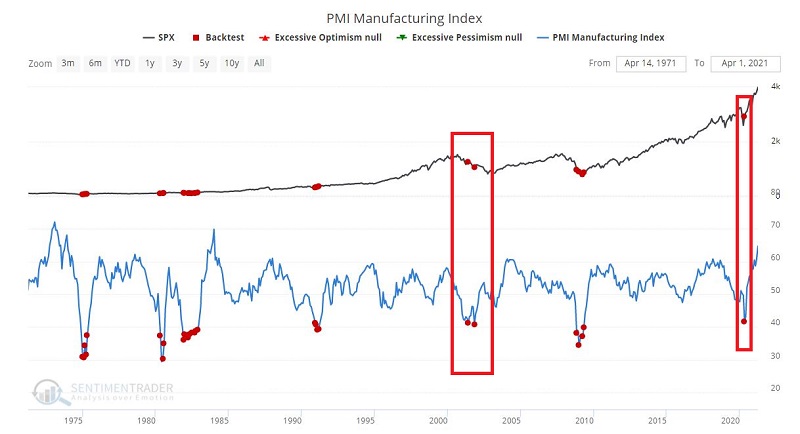
On the other side of the coin, the few instances when the PMI has moved above 64 appear in the chart below.

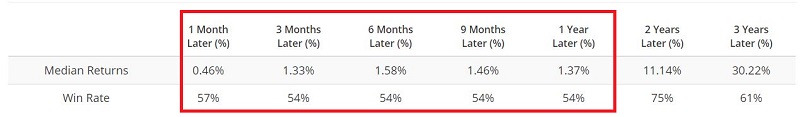
In the table below we find that while readings above 64 cannot necessarily be categorized as "bearish" for stocks, they are certainly no cause for celebration, with only fair to middling average returns on average in the following year.

The March 2021 PMI reading of 64.7% is a favorable sign that the economy is performing well. But the results here strongly suggest that most of this good news has already been discounted by the stock market during the rally since the March 2020 low.

NOTE: For testing purposes, the status of the latest PMI figure is analyzed at the end of the month in which it is reported.  

Sorry, you don't have access to this report

Upgrade your subscription plan to get access
Go to Dasboard
DATA &
TECHnologies
IndicatorEdge
‍
BackTestEdge
‍
Other Tools
‍
DataEdge API
RESEARCH
reports
Research Solution
‍
Reports Library
‍
actionable
Strategies
Trading Strategies
‍
Smart Stock Scanner
‍
FREE
RESOUrCES
Simple Backtest
Calculator
Simple Seasonality
Calculator
The Kelly Criterion
Calculator
Sentiment Geo Map
‍
Public Research Reports
‍
Free Webinar
COMPANY
‍
About
‍
Meet our Team
‍
In the News
‍
Testimonials
‍
Client Success Stories
Pricing
Bundle pricing
‍
Announcements
‍
FAQ
© 2024 Sundial Capital Research Inc. All rights reserved.
Setsail Marketing
TermsPrivacyAffiliate Program
Risk Disclosure: Futures and forex trading contains substantial risk and is not for every investor. An investor could potentially lose all or more than the initial investment. Risk capital is money that can be lost without jeopardizing ones’ financial security or life style. Only risk capital should be used for trading and only those with sufficient risk capital should consider trading. Past performance is not necessarily indicative of future results.

Hypothetical Performance Disclosure: Hypothetical performance results have many inherent limitations, some of which are described below. No representation is being made that any account will or is likely to achieve profits or losses similar to those shown; in fact, there are frequently sharp differences between hypothetical performance results and the actual results subsequently achieved by any particular trading program. One of the limitations of hypothetical performance results is that they are generally prepared with the benefit of hindsight. In addition, hypothetical trading does not involve financial risk, and no hypothetical trading record can completely account for the impact of financial risk of actual trading. for example, the ability to withstand losses or to adhere to a particular trading program in spite of trading losses are material points which can also adversely affect actual trading results. There are numerous other factors related to the markets in general or to the implementation of any specific trading program which cannot be fully accounted for in the preparation of hypothetical performance results and all which can adversely affect trading results.

Testimonial Disclosure: Testimonials appearing on this website may not be representative of other clients or customers and is not a guarantee of future performance or success.