
Managing Portfolio Risk with a Composite Market Breadth Divergence Signal

I'm a trend-following momentum investor. I like to own securities that have positive absolute and relative trends. Momentum investing involves a critical decision around the duration in one's ranking methodology. Because I use long-term measures, my momentum portfolio is susceptible to larger drawdowns and potential whipsaws as rankings are slow to adjust to new data. Over the years, I've researched how I can manage risk for my momentum style portfolio. The research project led me to the following conclusion. In addition to managing individual security risk, I should also be managing portfolio risk from a top-down broad market perspective.
In today's note, I plan to share another risk-off methodology I utilize to manage portfolio risk. The process seeks to identify a divergence between an index's underlying price and the internal participation amongst members as measured by a breadth composite.
Breadth Composite Indicator
The breadth composite contains two indicators that use long duration calculations. I prefer the long duration composite over a composite with short and long measures as it is less likely to produce whipsaw signals.
The composite includes the following:
- Percentage of Issues above the 200-Day Moving Average
- Percentage Spread Between 252-Day Highs and Lows
The individual component values are summed and divided by two to arrive at a single composite value. Please note, composite values can turn negative during corrections and bear markets as new lows overwhelm new highs in the spread calculation.
Breadth Composite Divergence Signal
The breadth composite risk-off divergence signal seeks to identify the following conditions.
- The Index price range rank is >= 90% over a user-defined lookback period
- The breadth composite range rank is <= 50% over a user-defined lookback period
- If conditions 1 & 2, start days since true count
- If days since 1 & 2 count is <= ten and the Index crosses below the price range rank of 80%, and the composite breadth level is below a user-defined threshold, signal risk-off
Note: Condition 1 and 2 use the same lookback period. I optimized lookback periods and composite level thresholds across various indices and exchanges.
Let's take a look at the breadth divergence signals across market capitalizations and exchanges.
Large-Cap Breadth
Please note, I calculated trading statistics in the S&P 500 chart as a short signal, whereas annualized returns result from buying the S&P 500.
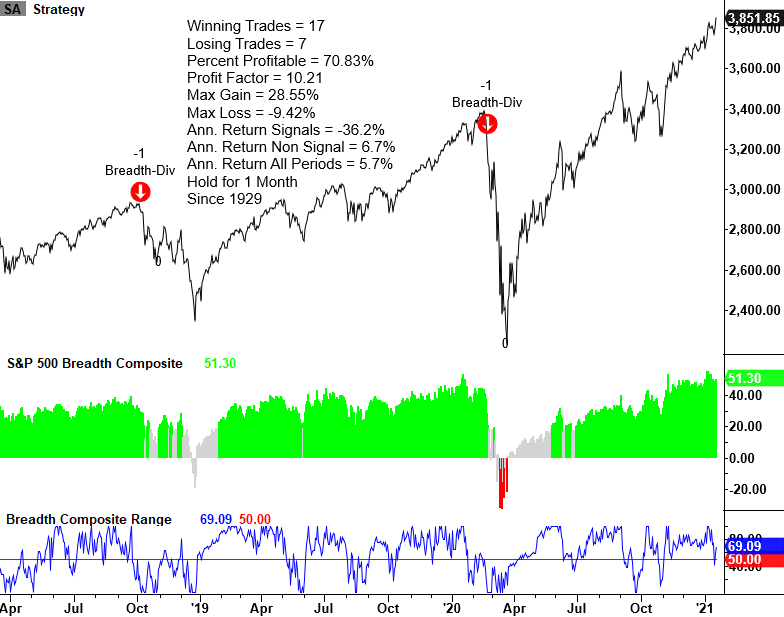
Large-Cap Breadth Signal Performance
Please note, I calculated performance statistics as a long signal.
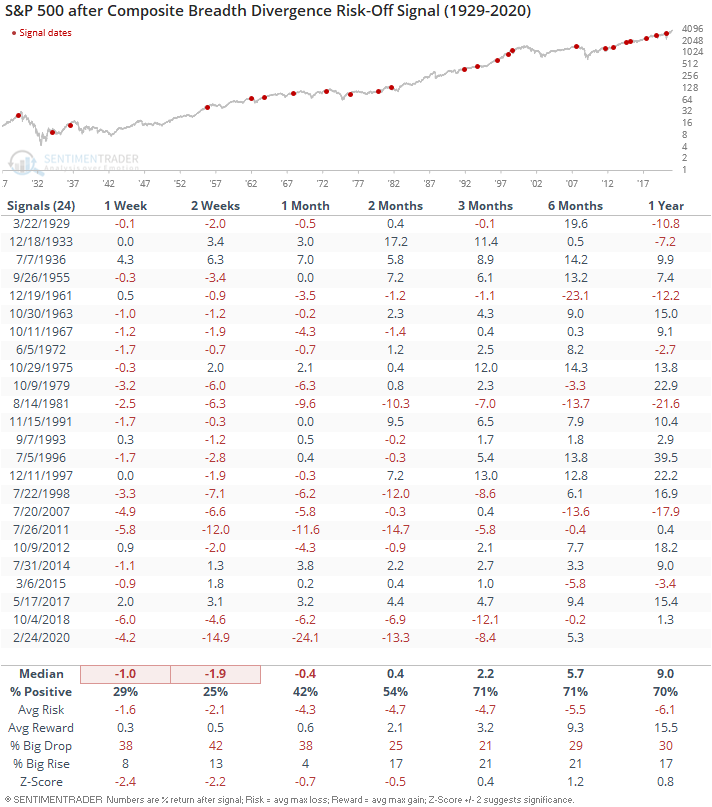
As the table below shows, short-term performance is weak after composite breadth divergence signals.
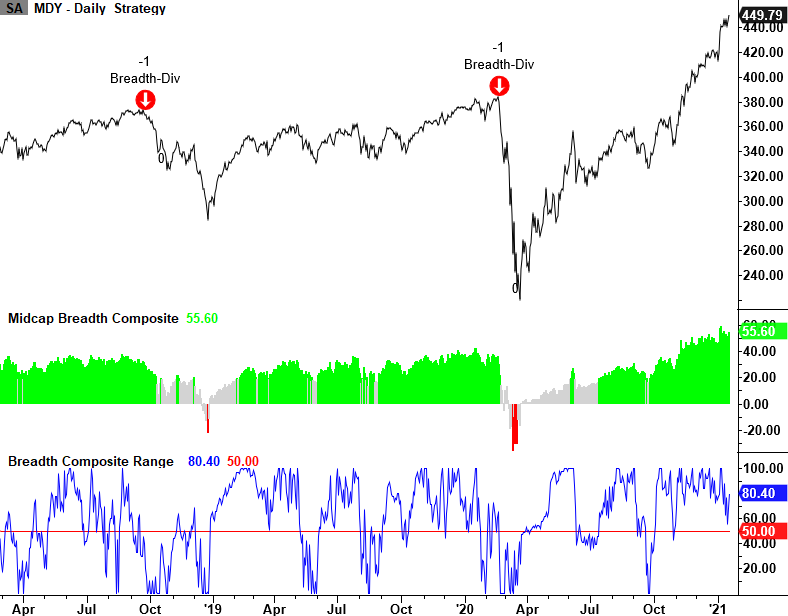
Mid-Cap Breadth
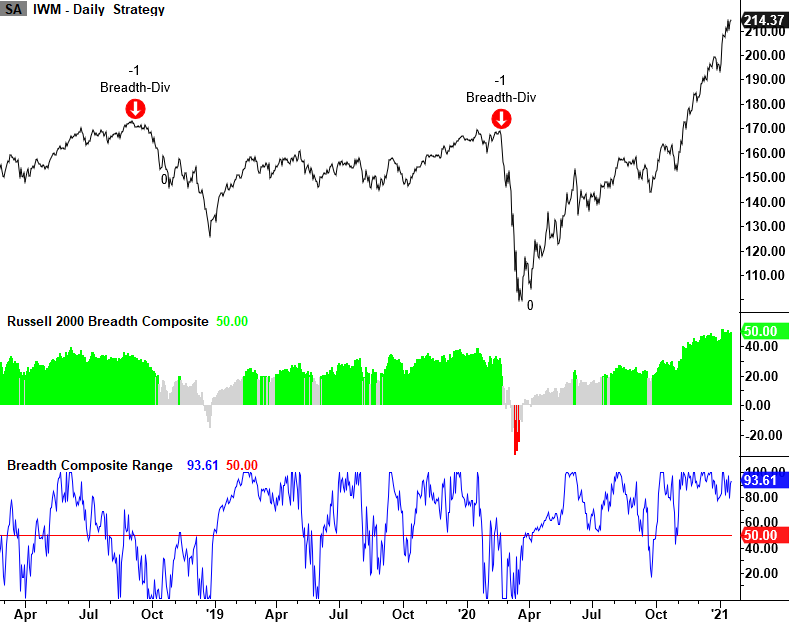
Small-Cap Breadth
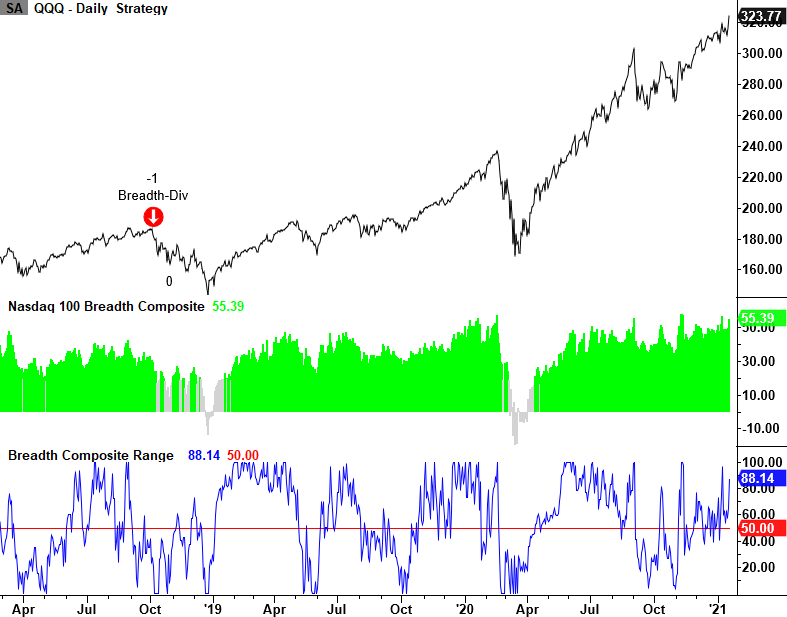
Nasdaq 100 Breadth
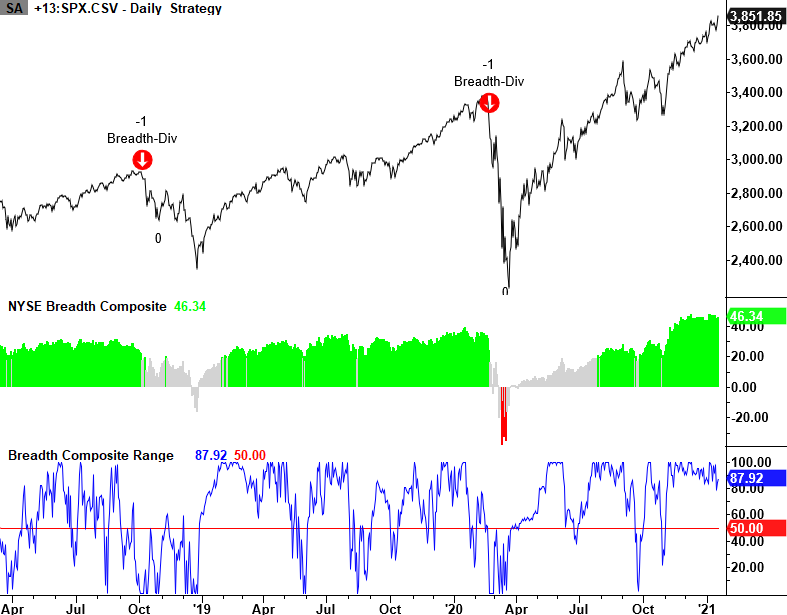
NYSE Breadth
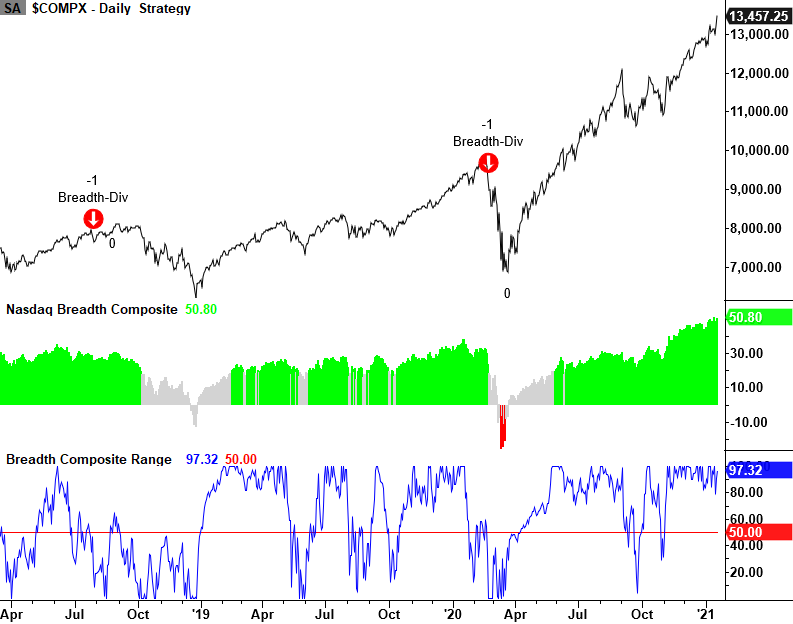
Nasdaq Breadth
Conclusion: Composite breadth divergence signals are less likely to trigger in the short-term given current composite levels and range ranks. When divergences occur, I like to see them across several indices and exchanges simultaneously. I use a weight-of-the-evidence approach to managing risk. The breadth composite divergence risk-off signals are one tool in a bundle of indicators across sentiment, breadth, relative ratios, and macro-level data that I track.